IEEE TRANSACTIONS ON COMMUNICATIONS, VOL. 50, NO. 4, APRIL 2002
553
A Multipath Model for the Powerline Channel Manfred Zimmermann and Klaus Dostert
Abstract—The development of powerline communication (PLC) systems for Internet, voice, and data services requires measurement-based models of the transfer characteristics of the mains network suitable for performance analysis by simulation. This paper presents an analytic model describing complex transfer functions of typical powerline networks using only a small set of parameters. The model is based on physical signal propagation effects in mains networks including numerous branches and impedance mismatching. Besides multipath propagation accompanied by frequency-selective fading, signal attenuation of typical power cables increasing with length and frequency is considered. A verification of the model at a test network, as well as its use for definition of attenuation profiles and reference channels, demonstrate the practical value of the proposed model. Index Terms—Channel model, multipath channel, powerline.
I. INTRODUCTION
A
S A RESULT of recent developments, the electrical power supply system is on the way to migrate from a pure energy distribution network to a multipurpose medium delivering energy, voice, and various data services. In particular, Internet access is currently in the focus of the efforts of various research activities [1]. The powerline network differs considerably in topology, structure, and physical properties from conventional media such as twisted pair, coaxial, or fiber-optic cables. Therefore PLCsystems have to encounter rather hostile properties [2]. For computer simulations oriented to appropriate system design, models of the transfer characteristics of the mains network are of major interest. Although some model proposals can be found in literature, their practical value is generally very limited, because most of them represent bottom-up approaches describing the behavior of a network by a large number of distributed components. Usually, matrices contain the properties of such components, either based on scattering parameters [4] or based on four-pole impedance and admittance values [5]–[7]. Obviously, detailed knowledge of all the components (cables, joints, connected devices) within a network is required for stetting up the matrices. In practice, it is normally impossible to determine the necessary parameters with sufficient precision. Only the work reported in [3] presents an attenuation and noise model which is based on measurements. However, like all the other models mentioned above, it is restricted to a frequency range below 150 kHz.
Paper approved by F. Santucci, the Editor for Transmission Systems of the IEEE Communications Society. Manuscript received October 10, 2000; revised March 29, 2001, and August 8, 2001. The authors are with the Institute of Industrial Information Systems, University of Karlsruhe, 76187 Karlsruhe, Germany (e-mail: Manfred.Zimmermann@ web.de;
[email protected]). Publisher Item Identifier S 0090-6778(02)03509-2.
In contrast to the known approaches, this paper outlines a top-down strategy considering the communication channel as a black box and describing its transfer characteristics by a frein the frequency range from 500 kHz up quency response to 20 MHz by very few relevant parameters. The structure of the model is based on fundamental physical effects, which were analyzed during a great number of measurements. However, in contrast to previous approaches, the relevant parameters are not derived from component properties, but from channel measurements. Some basic ideas into this direction were first published in [8], and at the same time a simpler and less precise multipath approach was given in [9]. Only in the case of very simple topologies, such as a cable with a single branch, the physical reasons for the observed results (cable loss, reflection, and transmission factors) can be easily identified. In real network topologies—which are always more complicated—a back-tracing of measurement results to physical reasons will generally turn out to be impossible. The proposed model will nevertheless describe the frequency response with sufficient precision. The parameters, however, cannot be directly derived from physical properties of the network. The paper is organized as follows. In Section II, the elements of the model are developed from physical propagation effects. The proposed model based on these elements is presented in Section III. Then the model is validated by means of a test network in Section IV. The applicability of the model to practical problems is discussed in Section V. The paper finishes with a concluding discussion in Section VI. II. PHYSICAL SIGNAL PROPAGATION EFFECTS This section examines the effects influencing transmission of communication signals on powerline networks and derives the basics for the model of the frequency response. A. Topology of the Mains Network Opposite to the telephone copper loop, the powerline “local loop access network” does not consist of point-to-point connections between substations and customer’s premises, but represents a line bus. A typical access link between a substation and a customer consists of the distributor cable, or a series connection of distributor cables, and the branching house connection cables, . The house both with a real valued characteristic impedance service cable ends at a house connection box, followed by the indoor wiring, which can be modeled from the point of view of the . access network by a complex termination impedance The impedance of the house connection point is usually low due to numerous branching in-house cables. Moreover, appears very stationary, since the low impedance point hides
0090-6778/02$17.00 © 2002 IEEE
554
IEEE TRANSACTIONS ON COMMUNICATIONS, VOL. 50, NO. 4, APRIL 2002
The losses of cables cause an attenuation increasing with length and frequency. The signal components of the individual paths have to be combined by superposition. Therefore, the frequency response from to can be expressed as (3) Signal propagation in more complicated networks with more branches can be partitioned into appropriate paths in a similar way.
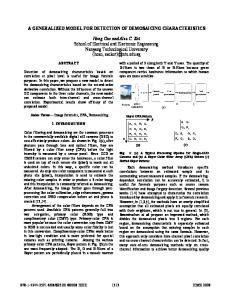
Fig. 1. Multipath signal propagation; cable with one tap.
impedance variations within the indoor network. Numerous reflections are caused by the joints of the house service cables, house connection boxes, and the joints at series connections of cables with different characteristic impedance. B. Multipath Signal Propagation Signal propagation does not only take place along a direct line-of-sight path between transmitter and receiver, but additional paths (echoes) must also be considered. The result is a multipath scenario with frequency selective fading. Multipath signal propagation is studied by a simple example which can be easily analyzed (Fig. 1). The link has only one branch and consists of the segments (1), (2), and (3) with the and the characteristic impedances , lengths , , and , and . In order to simplify the considerations, and are assumed and . The to be matched, which means remaining points for reflections are and , with the reflection , , , and the transmission factors factors denoted as , . With these assumptions, an infinite number denoted as of propagation paths is possible in principle, due to multiple re, , flections (i.e., , and so on). Each path has a weighting factor , representing the product of the reflection and transmission factors along the path. All reflection and transmission factors at powerlines are basically less or equal to one. This is due to the fact that transmission occurs only at joints, where the load of a parallel connection of two or more cables leads to a resulting impedance being lower than the characteristic impedance of the feeding cable. Hence, the weighting factor —a product of transmission and reflection factors—is also less or equal to one, i.e., (1)
C. Cable Losses As mentioned above, the propagating signals are affected by attenuation increasing with length and frequency. This section gives a closer look at the losses and derives a corresponding mathematical model. of a matched transmission line The frequency response of length can be expressed, by means of the complex propagation constant (4) depending on the primary cable parameters , and the voltage at distance , as follows:
,
, and
(5) and can be roughly estimated by The cable parameters the geometric dimensions and some material properties. Considering frequencies in the megahertz range, the resistance per is dominated by the skin-effect and is thus prounit length . The conductance per unit length is mainly portional to influenced by the dissipation factor of the dielectric material (usually PVC) and therefore proportional to . With typical and geometry and material properties, we have in the frequency range of interest. Hence, the cables can be regarded as weakly lossy with a real valued character. The complex propagation constant can istic impedance be determined using the simplified expression (6)
The more transitions and reflections occur along a path, the will be. Furthermore, longer smaller the weighting factor paths exhibit higher attenuation, so that they contribute less to the overall signal at the receiving point. Due to these facts, it is reasonable to approximate the basically infinite number of paths by only dominant paths, and to make as small as possible. The delay of a path
with the constants , , and summarizing material and geometry parameters. The real part of the propagation constant, the attenuation factor , increases with frequency. However, the exact relation between and for a special cable can be propor, to , or to a mixture of both, depending on either tional to or being dominant. Based on these derivations and extensive investigations of measured frequency responses, an approximating formula for the attenuation factor is found in the form
(2)
(7)
can be calculated from the dielectric constant of the insulating material, the speed of light , and the lengths of the cables.
which is able to characterize the attenuation of typical powerline links with only three parameters, being easily derived from the
IEEE TRANSACTIONS ON COMMUNICATIONS, VOL. 50, NO. 4, APRIL 2002
555
TABLE I PARAMETERS OF THE MODEL OF THE TRANSFER FUNCTION
measured transfer functions. With (5) and (7), the attenuation of a powerline cable can be characterized by
simply describes the weight of path . Thus, using (2), the final version of the frequency response is given by
(8)
(10)
Although the structure of (8) is derived from physical effects, the parameters , , and cannot be easily found from previously known cable parameters. This, however, does not limit the value of the model in practice, as it is generally impossible to get all the necessary cable and geometry data for real networks. Typically, the parameters , , and are derived from measured transfer functions. III. THE CHANNEL MODEL A. A Generalized Multipath Signal Propagation Model of the Transfer Function Combining multipath propagation described by (3) and frequency- and length-depending attenuation given by (8) finally leads to
weighting factor
attenuation portion
delay portion
a result which has been widely proved in practice. Table I explains the parameters. Equation (10) represents a parametric model, describing the complex frequency response of typical powerline channels, covering all substantial effects of the transfer characteristics in the frequency range from 500 kHz to 20 MHz by a small set of parameters, which can be derived from measured frequency responses, as shown in the examples in Sections IV and V. Moreover, the number of paths, , allows a control of the precision of the model, which is especially important for defining reference channels for PLC-system performance analysis. Applications of the model and the derivation of parameter sets will be explained in Sections IV–VI. IV. VERIFICATION BY MEASUREMENTS
(9) weighting factor
attenuation portion
delay portion
Equation (9) describes the signal propagation along a path by the delay portion and the low-pass characteristic, i.e., the attenuation increasing with length and frequency, by the attenuation portion. The weighting factor summarizes the reflection and transmission factors along a propagation path. Due to the fact that reflection points may exhibit complex and frequency-dependent values, is in general complex and frequency-dependent. The signal components of paths always add together at the receiving point. B. Simplified Model Extended measurement campaigns revealed that it is possible to further simplify the specification of the weighting factors to being complex, but not frequency-dependent. In many cases of practical interest, can even be assumed as real-valued. In heterogeneous networks, often several paths with almost equal delays exist, so that it is not rewarding to trace the factors back to their physical origins. From a multipath point of view,
A. Test Network For verification of the presented model, the results of simulations based on (10) are compared with measurements. This is done with a test network having a topology according to Fig. 1 and well-known geometric dimensions. The transmitter is located at position and the receiver at . and are matched with the characteristic impedance of the cable and point is left open, . Section (1) has a length exhibiting the reflection factor of 30 m, section (2) is 170 m long, and (3) is 12 m long. While sections (1) and (2) consist of a straight energy distribution cable of the type NAYY150 with a characteristic impedance of about 45 , section (3) is a house connection cable of the type NAYY35 with a characteristic impedance of approximately 70 . The transmitted and the received signals are recorded with a digital storage oscilloscope (DSO) and the complex frequency response is computed off-line on a PC. Since the propagation time of the signal leads to large overall phase values, a more detailed plot is generated by subtracting the linear phase portion. The resulting “phase detail” plot gives a better insight into frequency ranges with phase distortions. The reflections at the open tap cause periodical notches in the amplitude response, which can be easily seen in Fig. 2. The corresponding sections in the spectrum exhibit phase distortions.
556
IEEE TRANSACTIONS ON COMMUNICATIONS, VOL. 50, NO. 4, APRIL 2002
Fig. 3. Attenuation profile of a 150-m powerline link without deep notches.
V. APPLICATIONS OF THE MODEL
N =
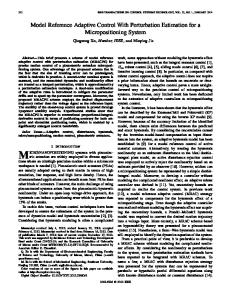
Fig. 2. Test network, measurement and simulation with (a) amplitude response, (b) phase details, and (c) impulse response.
4 paths:
TABLE II PARAMETERS OF THE FOUR-PATH MODEL OF THE TEST NETWORK
Because of the nonideal matching at and , additional small ripples in the amplitude response are visible. In the impulse response, the multiple propagation paths can be seen. Fig. 2 compares the measurement results with simulations paths. The based on the model according to (10) with used parameter set—listed in Table II—is derived from frequency response measurements. It is obvious that simulation and measurement differ only in minor details. The dominant paths of the impulse response are sufficiently covered by the simple four-path model. B. Parameter Estimation Strategy Estimation of the parameters requires a sophisticated strategy. The strategy applied to derive the parameters listed in this paper comprises a three-step approach. In the first step, the attenuation coefficients are determined from the attenuation profile using a single-path model with a least-squares estimator. In the next step, the number, position, and amplitude of the significant paths is derived from the impulse response by a simple peak detection approach. In less complicated cases, this step often delivers already sufficient accuracy. However, if a higher number of paths is needed, the parameters have to be further optimized by an evolutionary strategy with either impulse response or amplitude and phase response as quality measures.
The number of paths, , allows control of the precision of the model. This enables different applications, such as specifying simple attenuation profiles with only one path, detailed models of individual links with a great number of paths, or concise reference models with a moderate number of paths for simulative PLC-system performance analysis. Based on examples, these applications will be discussed in Sections V-A–D. A. Attenuation Profile The attenuation of powerline links is mainly influenced by cable losses and multipath fading due to reflections at branching points so that every link has its own attenuation profile. However, there are significant similarities regarding links with similar length, layout, and cable types. 1) Short-Distance Link: Short distance links (100–200 m) with only a few branches (1 to 4) mostly exhibit typical attenuation values starting from a few decibels at 500 kHz going up to 40–70 dB at 20 MHz. Fig. 3 shows an example measured at a 150-m link with a single 22-m branch supplying a small block of flats. The amplitude response is pretty smooth, exhibiting only some weak notches, which means that there is no significant impedance mismatch at the house connection point. Besides the measurement results, Fig. 3 also shows the amplitude response calculated by a model according to (10) with path with the weighting factor and the atten, 10 m , and uation parameters 10 s/m. The parameters were determined from the measurement using a least-squares fitting algorithm. It is evident that the difference between the model and the measurement is quite small. 2) Long-Distance Link: Typical long-distance links 300 m with PVC-insulated underground cables exhibit much higher attenuation, mainly caused by higher losses due to length and many branches (up to 15). Moreover, attenuation is often intensified by deep notches caused by multipath fading. Attenuation typically starts in a range from 10 to 30 dB at 500 kHz and may reach values of more than 80 dB at frequencies of 5–8 MHz (which is close to the noise floor of the used measuring equipment). Fig. 4 shows the measurement results of a link in an urban residential area with 12 branches supplying mostly small blocks of flats. Besides the amplitude response, the noise floor of the link is shown. Obviously, the attenuated
IEEE TRANSACTIONS ON COMMUNICATIONS, VOL. 50, NO. 4, APRIL 2002
557
Fig. 4. Attenuation and noise profile of a 330-m powerline link with deep notches.
Fig. 5. Length profiles of the attenuation of powerline links neglecting the impact of notches.
signal is falling below the noise floor at frequencies above 7 MHz. Additionally, the amplitude response exhibits several deep notches. Besides the measurement data in Fig. 4, simulation results path from an attenuation model according to (10) with , 10 m , and and the parameters 10 s/m are depicted. The attenuation parameters were estimated with a least-squares fitting algorithm, after preprocessing of the measurements data, so that only the frequency ranges not affected by deep notches were considered for parameter estimation. 3) Length Profile: Since positions and depths of notches do not depend on the length of the link, but only on properties of the branches (length and mismatch), it seems reasonable not to consider the impact of notches when specifying a length profile including only basic attenuation characteristics. For finding such length profiles, some 160 measurements from links in German low-voltage power distribution networks with PVC-insulated cables of the type NAYY or NYY were evaluated and separated into five length classes, namely 100 m, 150 m, 200 m, 300 m and 380 m. From each of these classes, the median value of the attenuation versus frequency was calculated and attenuation models similar to those presented in Sections V-A1 and 2 were determined. The results are shown in Fig. 5, and the corresponding parameters are listed in Table III. It should be noted that we now have median values of attenuation, so that particular links may differ substantially if they contain notches, other types of cables, or a special topology.
TABLE III ATTENUATION PARAMETERS CORRESPONDING TO THE LENGTH PROFILES
B. Detailed Models of Individual Links Attenuation profiles as presented in Section V-A are suitable to calculate the power budget for a link. For the design and computer-based performance analysis of modulation schemes, however, the complex frequency rsponse or the impulse response of powerline links are required. This subsection shows the capability of the presented model to deliver these details for real world networks. As an example of a frequency response with significant frequency-selective fading, a measurement result from a 110-m link recorded in an estate of terraced houses with 6 branches, each exhibiting a length of about 15 m, is shown in Fig. 6. Besides the amplitude response, the phase details are plotted versus
frequency. The very deep notches are a consequence of multipath propagation caused by the equally spaced branches of approximately the same length. To demonstrate the capability of the model for covering the complex frequency response of links with multiple propagation paths, the result of a simulation based on (10) is plotted in Fig. 6 for comparison. Especially in the frequency range below the first notch (4.5 MHz), the model matches the measurement excellently. Up to 15 MHz, there are only minor differences between simulation and measurement, and even above 15 MHz there is still fair coverage. The remaining deviations are due to the limited number of paths and the parameter estimation accuracy. Also, for the impulse response (in linear scale), the matching is pretty good over the complete time interval. The example clearly points out that the essential effects of signal propagation over powerlines can be captured by a model based on (10). However, for precise results, sometimes numerous paths (44 in the presented case) with individual weighting factors and lengths may be needed. Fortunately, on the other hand, a , and single set of attenuation parameters, namely 10 s/m, is normally sufficient. Nevertheless, it must be admitted that a model including a total number of 44 paths and 91 parameters is not easy to handle, and also the estimation of the parameters is quite difficult due to cross dependencies in the estimation algorithms. Therefore, Sections V-C and D are intended to point out a more useful compromise for practice. C. Reference Model For PLC-system performance analysis, simplified models with only a small number of paths representing not all the details but covering dominant effects are desirable. In this subsection, such a simplified reference model is discussed.
558
IEEE TRANSACTIONS ON COMMUNICATIONS, VOL. 50, NO. 4, APRIL 2002
TABLE IV PARAMETERS OF THE 15-PATH MODEL
Fig. 6. Detailed model with 44 paths. (a) Amplitude response. (b) Phase details. (c) Impulse response.
surement and model graphs, this may appear disadvantageous. However, regarding applications such as simulation-based PLC-system performance evaluation, it is more important that the model covers essential effects only, i.e., using well-defined reference channels. As such reference channels cover the general impairments of powerline links and hide unimportant details, they may represent useful and effective tools in practice. VI. SUMMARY AND CONCLUSION
Fig. 7. Reference model with 15 paths: (a) amplitude response, (b) phase details, and (c) impulse response.
A simplified model of the 110-m link from Section V-B is , covplotted in Fig. 7. The model has been reduced to ering the main paths for the impulse response. Due to the reduced number of paths, the frequency response of model and measurement exhibit some differences above 4 MHz, especially at the locations of the deep notches. However, the impulse response is still covered quite well by the model. The parameters of the 15-path model are listed in Table IV. D. Remarks on Accuracy The examples in the Sections V-A–C clearly demonstrate that the accuracy of the model applied to a real world scenario and on the exact strongly depends on the number of paths parameter settings. When analyzing the accordance of mea-
In this paper, a model of the complex frequency response of PLC links for the frequency range from 500 kHz to 20 MHz has been derived from physical effects, namely multipath signal propagation and typical cable losses. Measurements at a test network with well-known parameters prove good agreement between simulation and measurement results. Furthermore, the applicability of the model to real world networks has been demonstrated. The presented model offers the possibility to carry out investigations for different network topologies and to study their impact on PLC-system performance by means of simulations. Besides attenuation profiles, detailed models for individual links can be set up. Furthermore, reference models of typical channels can be defined for standardized PLC-system evaluation and performance comparison. This is an aspect of utmost importance, e.g., for upcoming PLC-service providers, in order to be able to select the best systems for their applications out of various competitors. REFERENCES [1] P. Langfeld and K. Dostert, “OFDM system synchronisation for powerline communications,” in Proc. 4th Int. Symp. on Powerline Communications and its Applications, Limerick, Ireland, 2000, pp. 15–22. [2] M. Busser, T. Waldeck, and K. Dostert, “Telecommunication applications over the low voltage power distribution grid,” in Proc. IEEE 5th Int. Symp. Spread Spectrum Techniques & Applications, vol. 1/3, Sun City, South Africa, 1998, pp. 73–77. [3] O. Hooijen, “A channel model for the residential power circuit used as a digital communications medium,” IEEE Trans. Electromagn. Compat., vol. 40, pp. 331–336, 1998. [4] G. Threin, “Datenübertragung über Niederspannungsnetze mit Bandspreizverfahren, Fortschrittberichte VDI, Reihe 10,” VDI-Verlag, Düsseldorf, 156, 1991. [5] J. Barnes, “A physical multi-path model for power distribution network propagation,” in Proc. 1998 Int. Symp. Powerline Communications and its Applications, Tokyo, Japan, Mar. 1998, pp. 76–89.
IEEE TRANSACTIONS ON COMMUNICATIONS, VOL. 50, NO. 4, APRIL 2002
[6] A. Dalby, “Signal transmission on powerlines—Analysis of powerline circuits,” in Proc. 1997 Int. Symp. Powerline Communications and its Applications, Essen, Germany, Apr. 1998, pp. 37–44. [7] M. Karl, “Möglichkeiten der Nachrichtenübertragung über elektrische Energieverteilnetze auf der Grundlage Europäischer Normen, Fortschrittsberichte VDI, Reihe 10,” VDI-Verlag, Düsseldorf, 500, 1997.
559
[8] M. Zimmermann and K. Dostert, “A multi-path signal propagation model for the powerline channel in the high frequency range,” in Proc. 3rd Int. Symp. Powerline Communications and its Applications, Lancaster, U.K., 1999, pp. 45–51. [9] H. Philipps, “Modeling of powerline communication channels,” in Proc. 3rd Int. Symp. Powerline Communications and its Applications, Lancaster, U.K., 1999, pp. 14–21.