A High Performance Algorithm for Clustering of Large-Scale Protein Mass Spectrometry Data using Multi-Core Architectures Fahad Saeed∗ , Jason D. Hoffert, Mark A. Knepper Epithelial Systems Biology Laboratory National Heart Lung and Blood Institute (NHLBI) National Institutes of Health (NIH) Bethesda, MD USA October 5, 2013
Abstract High-throughput mass spectrometers can produce thousands of peptide spectra from a single complex protein sample in a short amount of time. These data sets contain a substantial amount of redundancy (i.e. the same peptide is selected and identified multiple times in a single experiment) from peptides that may get selected multiple times in the liquid chromatography mass spectrometry (LC-MS/MS) experiment. The data from these mass spectrometers contain a substantial number of spectra that have low signal to noise (S/N) ratio and may not get interpreted due to poor quality. Recently, we presented a graph theoretic algorithm, CAMS (Clustering Algorithm for Mass Spectra) for clustering mass spectrometry data. CAMS utilized a novel metric, called a F-set, that allows accurate identification of the spectra that are similar with much higher accuracy and sensitivity than if single peak comparisons were performed. In this paper we present a multithreaded algorithm, called P-CAMS, for clustering of mass spectral data on multicore machines. The algorithm relies on intelligent matrix completion for graph construction and a load-balancing scheme for substantial speedups. We study the scalability performance of the proposed parallel algorithm on a multicore machine using synthetically generated spectra with parameters carefully chosen to mimic real-world mass spectrometry datasets. Real experimental datasets were also generated for quality assessment of the clustering results from the proposed algorithm. The results show that the proposed algorithms have scalable runtime performances and gives clustering results similar to a serial algorithm. The study also provides insight into the design of high performance algorithms for irregular problems in proteomics on many-core architectures.
1
Introduction
Mass spectrometry is a part of any modern large scale proteomics analysis. These studies are used for large-scale protein identification and quantitation and the data generated from a single biological sample can scale up to thousands of spectra [1][2][3][4]. Mass spectrometry based proteomics has proven useful in the recent past and had many potential biological applications [1, 5, 6, 7]. As mass spectrometers have become more efficient so has their ability to generate massive amounts of data, which can scale up to a million spectra. The raw mass spectrometry (MS) data is a combination of mass-to-charge (m/z) ratio and intensity of the peaks, and is much more complex than a typical next generation sequencing (NGS) data set due to its stochastic nature. Hence, after data generation there are multiple post-processing problems such as phosphopeptide filtering [8], false positive rate estimation [9], quantification of proteins from large datasets [1], and phosphorylation site assignments [10]. The usual computational route taken after generating the raw data is to search the spectra against a protein database and deduce the peptide for a given spectra using brute force search algorithm(s) such as Sequest * Correspondence should be addressed to Fahad Saeed at
[email protected]
1
and Mascot. These algorithms are not computationally efficient enough to analyze millions of spectra in a reasonable amount of time. One solution to efficiently dealing with this massive amount of data is to cluster the spectra and combine the clusters to formulate consensus spectra that can be used for further processing. Clustering of large-scale data is efficient because the peptides usually get selected multiple times in a typical MS-MS run, making a significant portion of the spectra redundant. Searching the same spectra repeatedly wastes both time and computational resources. The problem is even more pronounced when data from multiple runs are merged. The redundancy can reach up to 50% for large data sets [11, 12, 13]. Hence clustering is a viable solution to compress MS data sets and use these compressed representations of the spectra for further post-processing routines. Clustering of spectra can also increase the sensitivity of peptide identification (i.e. a higher number of peptide identifications than non-clustered data). The increase in identifications can be attributed to the fact that clustering allows low S/N spectra to be grouped with high-quality spectra, which in a non-clustered data set would be eliminated from identification. Clustering of MS/MS data is also known to reduce the number of false database identifications with low-quality spectra [11] by joining together the low and high quality spectra, the probability of making an erroneous identification is greatly reduced as compared to searching the low quality spectra separately.
1.1
Contributions
This paper is concerned with effective parallelization of the graph-theoretic framework for clustering of mass spectrometry spectra using multicore architectures. Parallelization of numerous applications using multicore architectures have been successfully pursued in the past [14, 15, 16, 17, 18, 19]. To this end, we introduce a multithreaded algorithm for clustering of mass spectrometry data using multicore architectures. Our design principles allow the algorithm to be ported on multicore/manycore systems. The contributions of the paper are as follows: 1. A parallelization strategy suitable for multicore systems using the novel F-set metric and graph theoretic framework is introduced. The parallelization strategy relies on speculation and selective choosing of the nodes that are used to establish the clusters. 2. We study the performance of our algorithm on an Intel multicore system and parallelism exploited in our clustering strategy. The performance study is conducted using carefully chosen spectral data, with variable parameters to mimic real world datasets. The results show that the proposed algorithm is highly scalable with increasing size of the datasets and significant time can be saved using our proposed techniques. We report super-linear speedups with our parallelization strategy. 3. A quality assessment of the proposed algorithms is done and compared with the sequential version of the algorithms. The data sets used for quality assessment are real data sets generated specifically to assess the quality of the clustering results given by the algorithm. The rest of the paper is organized as follows: In section 2, we briefly discuss the architectural background of the machines used and some benchmarking results. Section 3 will start with a brief introduction of the problem and the serial clustering algorithm introduced in [20] is discussed. In section 4 we will describe the multithreaded design of the algorithm which includes an intelligent matrix completion strategy, OPENMP implementation details and, load-balancing strategy. Section 5 discusses the experimental results which include quality assessment using experimental data sets and the scalability of the implemented algorithm. We end in section 6 with discussion and conclusions.
2
Architectures
The platform used in this study is an Intel based computer server (referred to as Falcon compute server at NIH). The Falcon system allows hiding latencies by using a memory hierarchy and supports two threads per core. We review this servers architecture and discuss specific details that are important for performance evaluation. Future studies would also include a parallel clustering algorithm on massively multithreaded architectures such as Cray XMT, not included in the current manuscript. 2
2.1
Falcon Compute Server Architecture
The Intel system that we considered is a compute server (named Falcon), consisting of two quadcore Intel(R) Xeon(R)E5620 processors each running at 2.40GHz. The system contains 8 physical cores with maximum of 2 threads/core. The processors supports Intel Hyper-Threading technology which allows thread-level parallelism on each processor that can be executed simultaneously i.e. multiple instructions can be executed in a given cycle. The system has 60GB of RAM. The memory system per core consists of 32KB Instruction cache (Li); 32KB data cache (Ld). Further there is 256KB of L2 cache and 12MB of L3 cache shared by eight cores. The maximum memory bandwidth of the system is 25.6 GB/s. In order to benchmark the compute system we ran Intel Optimized LINPACK benchmark data. The parameters were set as: number of tests=15, problem size= 1000 to 45000, Leading dimension of array 1000 to 45000, and the number of trials and data alignment values of 4 (maximum). Using the above parameters the system was able to perform at peak performance of 33.9 GFLOPS. The time it took to run the maximum problem size was 1258 seconds. We also ran the STREAM benchmark to assess the memory performance of our system. The results were as follows: Copy rate = 3419 MB/s, Scale Rate = 3305 MB/sec, Add Rate = 7532 MB/sec, and Triad = 4976.6 MB/sec.
3
Problem Statement and Background Information
Mass spectrometry data is complex and requires numerous algorithms after the raw data is generated to obtain useful information. Usually, the raw data is fed to multiple search engines (e.g. Sequest, Inspect). These search engines do a thorough job of searching the spectra against a known database and each spectra is assigned to a peptide. However, redundancy and low S/N ratio of the data makes these search tools inefficient. Accurate clustering of mass spectrometry data eliminates the computational inefficiency of the search tools while allows scientists to get better identifications out of the data. Multiple clustering algorithms have been proposed in the past which include, Tabb et. al [21], MS2Grouper algorithm [22], Beer et. al. developed the Pep-Miner algorithm [11], Ramakrishnan et. al. [23], Dutta et. al. [24] and Frank et. al. [13]. More recently a clustering algorithm using graph-theoretic concepts was introduced by Saeed et. al. [20]. The authors are not aware of any parallel clustering algorithms for mass spectrometry data to date.
3.1
Overview of the Serial Clustering Algorithm
The objective of the clustering algorithm is to select the spectra such that the clustered spectra belong to the same peptide. Note that the clustering is done before any spectral searching i.e. the peptides that correspond to the spectra are not known when clustering is accomplished. We will briefly discuss the main ideas behind the serial clustering algorithm, called CAMS first introduced in [20]. Suppose there are N number of spectra that needs to be clustered. Now assuming each spectra belongs to a single peptide, we would like to group the spectra’s that belongs to the same peptide. Clustering of spectra can be accomplished by estimating the similarity of the spectra with respect to each other and determining if the similarity is high enough to group them. In order to assess the similarity of the spectra, we introduced a novel similarity criteria, called F-set metric [20]. The basic idea behind F-set metric is to create groups of consecutive peaks for a given spectra, and then calculate the common groups between two given spectra to estimate the similarity. The grouping of peaks allows better estimation of similarity between spectra when compared to calculation of similarity just by counting common peaks. The rationale for using groups of peaks instead of single peaks is as follows: It is possible for peaks to appear at certain m/z by random chance. However, it is far less likely for peaks to appear in consecutive succession just by chance. The F-set makes a set of m/z from a spectrum of size f and then compares it with the F-set of another spectrum. If there is a match of a F-set in the other spectra a score of 1 is added. Otherwise a score of zero is added. Therefore, the final score W represents the number of F-sets that are common between the two given spectra. Next, a graph-theoretic framework is defined that allows the CAMS algorithm to take advantage of the F-set metric and use it to cluster the spectra in an efficient manner. A graph is created and the edges are weighted using the F-set metric calculated between a pair of 3
A
B
C
D
E
F
A X
40 51 32
4
16
B X
X
72 21
17
7
C X
X
X
43
1
21
D X
X
X
X
3
19
E X
X
X
X
X
92
F X
X
X
X
X
X
D A C B E F
21
7
92
C
B
19 72 43
16
1
17
21
51 3
D
E 40
32 4 A
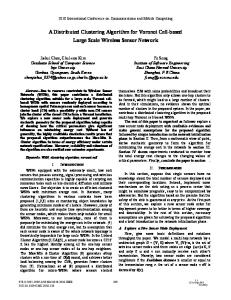
Figure 1:
An example of the spectral graph created using F-set metric is shown along with the adjacency matrix. The example illustrates that not all of the combinations in the matrix have to be filled up to determine the clusters and a few weighted edges can be used to determine the clusters. In this example it can be seen that only edges (denoted by blue and red) are necessary for successful clustering calculations. Different color edges represent distinct clusters.
4
spectra. A threshold is then defined, called ζ, to remove the edges that have a weight less than the specified threshold. The vertices that are still connected via an edge are considered to be clustered together. The reader is encouraged to look up formal definitions related to the serial algorithm in our original clustering paper [20] for more details.
4
Multithreaded approach to CAMS algorithm
In order to parallelize the CAMS algorithm using multicore architectures we made few fundamental changes to the design of the algorithm. These changes make the serial version of the algorithm more efficient and allow us to exploit parallelism on multicore machines.
4.1
Intelligent Matrix Filling
The crux of the algorithm is the F-set metric that has to be calculated between two given spectra. This weight is then used to form weighted edges for the graph. An adjacency matrix has to be filled up with weights that are calculated using the F-set metric definition for each vertex. Each of the weights that is added to the matrix has to be calculated using the F-set definition and is computationally expensive. We wanted to investigate if we could do the same without computing all the combinations of F-set metrics for each of the spectra under consideration i.e. if we could fill up the adjacency matrix more intelligently so that all the possible combinations are not computed but same clustering results are achieved. The basic idea for filling up the matrix in an intelligent way is the observation that we do not need to compare all the combinations to fill up the matrix i.e. if a vertex (which corresponds to a single comparison) has already been added to a cluster, then there is no need to further compute the edges related to this vertex. In other words, if a vertex has been added to any of the cluster trees, then we do not need to compute any more F-set metric related to that vertex. Cluster trees are the tree structures that are formed when spectra are merged as groups. Looking at Fig. 1 it can be seen that when traversing the first row of the matrix, vertices B,C,D are added to the cluster tree (vertex A). This is indicated by red numbers in the matrix and red edges in the corresponding graph that have been connected due to the weight of these edges greater than the threshold ζ = 30 (for this example). Now the other comparisons such as between (B,C), (B,D) and (C,D) are redundant because they do not add any information to our existing knowledge about the spectra i.e. (B,C,D) should be added to the graph that has vertex A. Using this intelligent matrix filling technique, the code can avoid expensive spectral comparisons that are redundant. In order to illustrate how the intelligent matrix filling works let us look at Fig. 2. The array1 and array2 contain the names of all the spectra under consideration. Note that two arrays are shown in the example to illustrate a point more clearly and the same method can be implemented using a single array. The matrix on the right of the arrays shows the total one-to-one possible combinations between the spectra. The definitions dictate that the edges are undirected, in turn making the comparisons between vertices bi-directional i.e. comparing A → B is the same as comparing B → A. Therefore half of the matrix represent the don’t care cases denoted by X. Now traversing the array to fill in the matrix with the values sufficient for our purposes. We start with a pointer at array1 with the first element at index=0 and all of the elements in array2 B, C, D, E and F are compared with A. The weight is calculated using the definitions introduced in the paper and the weights that are greater than the threshold are marked as red. If the weights are marked as red in the matrix, the array2 would have a X placed in it to represent a dont care case. The pointer is then incremented to the next index and all the indexes that have a X placed in the array2 are skipped. In this way the cells that are denoted by ∅ in the matrix are not calculated, saving precious computational time. The matrix can be filled with this approach for all indexes. Note that for the example presented in the figure, the computational saving using intelligent matrix filling is equal to 20% and the savings increase rapidly with increasing number of spectra.
5
array1
i=0 A
B
C
D
E
X X X X A B C D E
i=1 X A B
F array2 F
array1 C
D
E
X X X X A B C D E
i=2 X X A B C
F array2
E
X X X X A B C D E
i=3 X X X A B C D
F array2
X X X X A B C D E
i=4 X X X X A B C D E
F array2
16
0
0
0
0
C X
X
X
0
0
0
D X
X
X
X
0
0
E X
X
X
X
X
0
F X
X
X
X
X
X
16
A X
40 51 32
4
B X
X
∅
∅
17
7
C X
X
X
0
0
0
D X
X
X
X
0
0
E X
X
X
X
X
0
F X
X
X
X
X
X
16
A X
40 51 32
4
B X
X
∅
∅
17
7
C X
X
X
∅
1
21 0
D X
X
X
X
0
E X
X
X
X
X
0
F X
X
X
X
X
X
16
A X
40 51 32
4
B X
X
∅
∅
17
7
C X
X
X
∅
1
21 19
D X
X
X
X
3
E X
X
X
X
X
0
F X
X
X
X
X
X
16
F
array1 F
X X X X X X array2 A B C D E F
Figure 2:
4
X
F
array1 E
40 51 32
F
array1 D
A X B X
A X
40 51 32
4
B X
X
∅
∅
17
7
C X
X
X
∅
1
21
D X
X
X
X
3
19
E X
X
X
X
X
92
F X
X
X
X
X
X
The intelligent filling of the weight matrix is shown. The red X for the array’s indicate that the particular node has been added to the tree and no longer is included in the candidates that must be included in the cluster. However, the node is still checked against other nodes so that vertices that have only one edge are also included in the tree e.g. node B is included in the tree in the first stage and is eliminated as a candidate that needs to be included. However, node B is still traversed against other candidates to make sure that vertices that only have one edge with B are also included in the cluster. The blue X in the arrays indicating that the node has been traversed and no longer requires any comparison. Further, an edge from A to B is considered same as B to A. The ∅ in the matrix indicates that the particular comparison is not performed because the said nodes is already part of some tree. This saves 20% of computation time for the illustrated example and savings get more significant with larger datasets. 6
4.2
Effective CAMS Algorithm
With the introduction of the intelligent matrix filling strategy, precious CPU cycles are saved. The intelligent matrix filling allows us to exclude comparisons without explicitly comparing all spectra. Thus, the complexity of the algorithm reduces from all-to-all comparison by a factor of percentage of cluster that is present in the data under consideration. The modified CAMS algorithm is stated in Algorithm 1 and 2. Algorithm 1 GenerateFsets (Vector V, int size) Require: Vector of spectra containing m/z (vector V, int size) Ensure: Generates Fsets from a vector V of m/z of stated size F set ← ∅ for (i = 0; i < V.size(); i + +) in parallel do if (i + size <= V.size()) then for (j = 0; j < size; j + +) do temp ← V [i] F set = F set + temp i++ end for i = i − size F set = F set+; // ; is used as a sentinel character to distinguish between sets of Fsets end if end for return F set The part of the algorithms that are relevant to the parallelization are presented in the paper. Algorithm1 shows how we generate the Fset as defined in the paper. The algorithm shows that the m/z of the spectra is extracted from the .dta files from raw data and made into a vector. This vector V is read and Fsets of specified size are generated. A sentinel key is also defined to divide the sets that are defined. Algorithm2 takes in two vectors that contain F-sets. These vectors are used to compare the F-sets and return the number of sets that are common between the two. Algorithm 2 comparekmerset (string first-string, string second-string) Require: Pair of Fsets string generated from m/z of spectra using GenerateFsets function Ensure: Returns the number of Fsets that are common between the two spectra /* splitfunction(string X) takes a string X and changes it into vector where each entry in vector corresponds to a single F-set */ vector firstv=splitfunction(first-string) vector secondv=splitfunction(second-string) int count=0 for (i = 0; i < f irstv.size(); i + +) in parallel do for (j = 0; j < secondv.size(); j + +) do if (f irstv[i].compare(secondv[j]) == 0) then count++; end if end for end for return count; The Algorithm 3 requires some explanation. The algorithm starts with an array called Fsetarray is filled using the generateFset method mentioned in Algorithm1. In this way Fsetarray is filled up with Fsets for each of the spectra that are under consideration. After the Fsets have been generated and filled up the Fsetarray, the intelligent matrix filling and connecting of the edges is initiated. Since the ordering in which spectra’s are placed in the matrix can 7
Algorithm 3 Cluster Spectra (N spectra, Fsetsize) Require: N Spectra, Fsetsize Ensure: Cluster the spectra and output the connected components F setarray[] ← ∅ f ilearray[] //Each entry in filearray contains m/z of a single spectra for (k = 0; k < N ; k + +) in parallel do F setarray[k] = GenerateF sets(f ilearray[k], F setsize); end for // randomize the ordering of N for (i = 0; i < N ; + + i) in parallel do if (F setarray[i] 6= ∅) then for (j = i + 1; j < N ; + + j) do if (F setarray[i] 6= ∅ && F setarray[j] 6= ∅) then if (comparekmerset(F setarray[i], F setarray[j]) ≥ threshold) then //draw an edge between spectra named filearray[i] and filearray[j] in Graph G e(f ilearray[i], f ilearray[j]) F setarray[j] ← ∅; end if end if end for end if F setarray[i] ← ∅ end for return connected components of Graph G
effect the running times of the strategy; we randomize the ordering in which spectra are inserted in the matrix to eliminate any adverse effects ordering may have on the running times. Note that the second for loop is only initiated if the Fsetarray[i] has not be invalidated, denoted by ∅. The invalidation of the entry occurs when the said node has been added to any of the clusters. Likewise the comparisons only takes place if both of the entries in the Fsetarray i and j are valid. If both of the Fsetarray entries are valid then comparekmerset method (Algorithm 2) is executed. The comparekmerset method is computationally expensive and counts all the instances of Fsets that are common between the two spectra under consideration. The count is then used as a similarity metric i.e. greater the similarity, greater the count. If the count received back from the method is greater than a certain threshold, then an edge is added for the two nodes under consideration. The two vertices are then nullified so that no more comparisons take place for the node that has already been added to the cluster tree. At the end of the algorithm the connected components from graph G are reported. Each tree formed in graph G is considered a cluster of spectra. Note that the components that are connected would have greater probability that they are related to each other (i.e. belonging to the same peptide) due to large number of F-sets that are common between them.
4.3
OPENMP Implementation
Now we discuss the OPENMP implementation of the improved CAMS algorithm. The implementation of the algorithm was done using gcc version 4.4.6 20110731 (Red Hat 4.4.6-3) and Linux Scientific version 2.6.32 − 220.13.1.el6.x8664 as the operating system. Please note that only main loops and computationally intensive parts of the code would be illustrated. 4.3.1
Counting common Fsets between spectra
One main section in the code is counting the number of Fsets that are common between two given spectra. For the code shown in Fig. 4 it is assumed that the vectors that are taken as input have the Fset in place. In order to facilitate the counting procedure from two vectors a #pragma omp parallel for
8
with the reduction(+:count) is used. The reduction(+:count) clause performs a reduction on the variables that appear on the list, which in our case is the integer count. Using this clause a private copy of count is created for each thread and at the end of the reduction, count variable is applied to all the private copies of the shared variable and the final results are written to the globally shared variable. In this way the counting process becomes highly parallelized. a
a
1
a
a
1
a
b Core1
a
b
1
2
c
a
d
2
a
b
13
a
c
b
2
b
c
13
d
d
2
e
3
a
Core2
d
2
b
e
d
3
c
f
Input
3
d
f
Redistributed
Core3
Figure 3: The upper array is the default spectra input that will produce very unbalanced loads. As shown in the figure for 3 threads, the first thread or core would have the greatest load. However, the computations done on first core would not lead to reduced load on other cores i.e. the elimination of the possibilities is not ’propagated’ across cores leading to very unbalanced loads. In the redistributed load (shown in the lower array), it can be seen that the computation done on one of the cores would lead to reduced load on other cores. Hence the load is more evenly distributed over the cores leading to more balanced computations across cores. Since, each of the spectra (node) is scheduled to be compared with each of the other spectra(node), the redistribution allows the algorithm to reduce the possibilities that need to be compared on other cores. Although, the redistribution and updating on the global memory incurs a communication cost, it is much less than the cost to actually compare the spectra.
4.3.2
Parallelizing the Main Loop in Algorithm 3
The parallelization of the main loop using openmp pragmas is shown in Fig. 5. The TOTAL_ITEMS refers to the total number of spectra that have to be clustered. The kmer_set is an array which contains the Fsets from the spectra created from the earlier step. The contents of this array are used to compare the Fsets between two given spectra. If the spectrum becomes a dont care condition according to our intelligent matrix filling, we denote it with an XX. There are two methods used in the code shown. mystring() return a string XX and the method comparekmerset(string x, string y) returns the number of Fsets that are common between two given strings (Algorithm 2). The outer loop is parallelized using #pragma omp parallel with array kmer_set is a global array that is shared among all the threads. The variables i and j are kept private and each thread get its own copy. The global array kmer_set can be updated at two places; one update can occur at the outer for loop that happens when an iteration of the inner loop is completed. The other update, which is more critical, is in the inner for loop that updates the array whenever a comparison from the method comparekmerset returns a weight greater than the required threshold. Since, the array kmer_set is global in its nature, it is necessary to make #pragma omp flush to give the other threads a coherent view of the global array. However, the flush update is an expensive process. Therefore, we opted for a row-wise update of the global array i.e. the update for the global array is done once all the iterations in the inner loop are completed. Therefore, other threads will see the dont care condition by the inner loop once iteration has completed. However, explicit flush is not necessary in our case since an flush is implied when exiting the for loop. 9
int comparekmerset(string first_string, string second_string){ /* splitfunction(string X) takes a string X and changes it into vector where each entry in vector corresponds to a single F-set */ vector
firstv=splitfunction(first_string); vectorsecondv=splitfunction(second_string); int count=0,i=0,j=0; #pragma omp parallel for reduction(+:count)private(i,j) for(i=0;i
Counting the number of F-sets common between two given spectra. Vectors firstv and secondv contains Fsets created from the spectra of a specified size
int count=0,i=0,j=0; #pragma omp parallel for shared(kmer_set)private(i,j) for(i=0;i=threshold){ kmer_set[j]=mystring(); } } } } kmer_set[i]=mystring(); }
Figure 5: Parallelizing of the main loop used for calculating weights on edges of the Graph G using OPENMP pragmas
10
Note that we use arrays to code our algorithm. We also implemented the same algorithm using linked lists and stacks instead of arrays and found that the running time increased when compared to the same implementation with arrays. The increase in time for linked list and stack implementation can be attributed to time consumed in deleting the linked list nodes and reinserting stacks values. It is also more convenient to deal with arrays in OPENMP and Cray XMT implementation instead of linked lists or stacks which require an explicit iterator to go through their structures. 4.3.3
Load Balancing
Load balancing is one of the most important attributes necessary for performance of a parallel algorithm [25, 26]. Load balancing is important because it ensures that the processors/cores are busy for most of the time the program is running. Without a balanced load, some of the threads may finish much later than others, making the running time of the program bounded by the last thread that completes. In general the computational load of a single iteration for a given thread/core cannot be predicted before actual execution. However, the specific nature of the mass spectrometry data under consideration will let us craft a load-balancing scheme that allows near equal loads on each core. The load-balancing scheme is based on the following observation about mass spectrometry data. The data from mass spectrometry is indexed using the mass-to-charge (m/z) ratio of the peptides i.e. the peptides that have similar m/z ratio would be ejected from the mass spectrometer in consecutive chunks. Now according to our intelligent matrix methodology, we can see that if elements of the clusters are present on the same core, then that core would be done with computation much more quickly than other cores. Fig. 3 shows the scenario for an unbalanced load. As can be seen in the top array that same kind of spectra are present on the same core, the load would be unbalanced. The reason is that if same spectra are present on a core, the number of don’t-care-condition would increase more rapidly than the core that has fewer numbers of spectra that are similar. Now we redistribute the spectra on different cores which is shown at lower end of the array in the Fig. 3. Now when comparisons for spectra a are completed, the resulting load-reduction occurs on cores 2 and 3. The load-reduction is uniform which leads to more balanced load-per-core for the algorithm. The load is therefore distributed in a round-robin fashion over the number of cores. This corresponds to static scheduling in OPENMP code. In order to test if the technique works correctly we took 2000 and 4000 spectra and applied various scheduling combinations. The results of applying these scheduling techniques can be seen in Fig. 6. The scheduling techniques applied were 1) dynamic scheduling, 2) ordered loops with dynamic scheduling 3) ordered scheduling and 4) static scheduling with different chunk sizes. As can be seen in the figure that the first three scheduling techniques performed poorly with increasing number of threads. The performance degrades further with increasing data set size as can be seen for the performance of 4000 spectra. The trend of poor performance continues with increasing number of spectra. Now let us take a look at the performance of static scheduling in light of our discussion in previous two paragraphs. It can be seen that for both 2000 and 4000 spectra, the static scheduling scales very nicely with an increasing number of threads. The chunk size has negligible effect on the run time with static scheduling.
5
Experimental Results
The quality of the clustering results was estimated using both CID and HCD data sets described in our paper [10]. The objective of this quality assessment is to make sure that the clustering results are consistent with the results that we get for our serial algorithm. In order to assess the scalability of the algorithm with increasing number of spectra we implemented a spectra generator. The basic idea of the generator is to specify percentage of the spectra that are to be clustered, and generating the rest of the spectra randomly. This way we would get spectra that are close to the real-world data sets. We did the experiments with 30% of the spectra that would be clustered together and rest of the data is randomly generated for a given number of spectra. The randomly m/z and intensity are chosen for random spectra and are similar to real-world spectra obtained from mass spectrometry LC-MS/MS experiments.
11
3,000
Wall Clock Time (seconds)
2000 Spectra
dynamic(default)
2,000
dynamic(ordered)
ordered(default)
1 1,000
2 512 132 32 4
1024
8 256 64 16
0 0
5
10
15
Number of Threads · 104 ordered(default)
4000 Spectra Wall Clock Time (seconds)
1 dynamic(ordered)
dynamic(default)
1 0.5 2
4
512
132 8
16 32 64 256
1024
0 0
5
10
15
Number of Threads
Figure 6: Wall Clock time with different scheduling strategies for 2000 and 4000 randomly selected spectra is shown. The numbers on the line graphs show the chunk size used for static scheduling. The other scheduling strategies investigated were dynamic, dynamic & ordered and ordered. Considering the intelligent matrix procedure, the static scheduling strategy works best as discussed in the load-balancing section. The chunk size seems to have minimal effect on the strategy.
12
Table 1: Summary of results for HCD and CID datasets. The average size of the cluster and the average weighted accuracy of the datasets are shown. Compression(%) is equal to Initialsize−newcompressedsize × Initialsize 100 CID datasets No. of spectra Clustered spectra Total clusters AWA(%) Compression (%) AQP2-H-(S256/S261) 2816 593 174 97.3 14.9 AQP2-M-(S256/S261) 2553 662 171 98.1 19.3 AQP2-L-(S256/S261) 2386 531 167 98.5 15.3 AQP2-H-(S264) 1842 485 153 98.7 18.0 AQP2-M-(S264) 1919 499 167 98.8 17.3 AQP2-L-(S264) 2163 490 166 96.3 15.0 HCD data sets AQP2-H-(S256/S261) 2282 254 76 99.2 7.8 AQP2-M-(S256/S261) 2713 262 72 99.2 7.0 AQP2-L-(S256/S261) 2754 283 84 98 7.2 AQP2-H-(S264) 2060 132 44 98.5 4.3 AQP2-M-(S264) 2084 155 54 100 4.8 AQP2-L-(S264) 2267 164 57 100 4.7
5.1
Scalability Results with OPENMP Implementation
In order to assess the scalability of the proposed parallelized algorithm we tested an OPENMP implementation on falcon server. The CPU times and the associated speedups can be seen in Fig. 7 where CPU times drop sharply with increasing number of threads. The behavior is consistent with increasing number of data set size. It is apparent that significant speedups are achieved with an increasing number of threads. Another observation is that the speedups are approximately the same with increasing size of the data sets. It is also interesting to note that the speedups are super-linear in nature i.e. the speedups achieved are more than the number of threads. These super linear speedups can be attributed to the design of the parallel algorithm using intelligent matrix completion. The intelligent matrix completion procedure allows multiple threads to eliminate large number of possible comparisons in parallel and hence amounts to super linear speedups.
5.2
Quality Assessment
The average weighted accuracy (AWA) allows us to assess the intra- as well as inter- accuracy between clusters as defined in [20]. AWA takes into account the accuracy of each cluster and gives a global view of the accuracy for a given dataset. Note that the spectra to peptide matching has been done using Sequest for the data sets in our experiments. This a priori information allows us to do a accuracy assessment of the clustering algorithm. The accuracy obtained using P-CAMS algorithm for the data sets is shown in table 1. As can be seen in the table P-CAMS algorithm gives accuracy very close to 100% for CID as well as HCD data sets. This shows that the accuracy of the clusters formed for the data sets as well as average accuracy is very close to 100% making it a reliable algorithm to cluster complex mass spectrometry data sets. The compression ratios of the datasets are also stated in the table. We also compared the results from P-CAMS with other algorithms such as MS-Cluster and SPECLUST. Our experiments suggest that the clusters obtained using P-CAMS are more accurate and precise than either of these tools (results not shown).
6
Discussion and Conclusions
Clustering has potential advantages in post-processing procedures, by grouping and compressing large complex mass spectrometry datasets. Clustering also helps to identify peptides and proteins that are low in abundance and result in low quality (low S/N ratio) spectra. Modern mass spectrometers are 13
CPU Time in seconds (log scale)
105
32000
104
16000 8000
103
4000 2000
102
0
5
10
15
Number of Threads 40
30
Speedups
32000
20
16000 4000
10 2000
8000 0 0
5
10
15
Number of Threads
Figure 7: CPU time and the speedups with increasing size of the data set and increasing number of threads. Number on the lines in the graphs represent the size of the data set
14
capable of generating large numbers of mass spectra in a short amount of time. Efficient techniques that are able to cluster mass spectrometry data in a reasonable time with high accuracy are necessary for answering important biological questions. In this paper we have described a parallelization technique for clustering of large-scale mass spectrometry data using multicore systems. First, an efficient and effective version of CAMS algorithm, based on selective selection of spectra is presented in the paper. Thereafter, a parallel formulation of this effective CAMS algorithm is illustrated. The parallelization strategy, called P-CAMS, is based on intelligent matrix completion (for the clustering graph) and effective load-balancing scheme using multicore architectures. In order to assess the effectiveness of the parallel algorithm we used both simulated and synthetic(real) data sets. Our experiments suggest tremendous decrease in runtime with increasing number of threads. The parallel approach is also shown to be extremely scalable with increasing data set size, and exhibits super-linear speedups with increasing number of threads. Experimental data sets using real mass spectrometry techniques were generated for assessing the quality of the clustering algorithm. We report very high quality clusters (near 100% accuracy) using P-CAMS algorithm. The objective of this work is to provide a tool to systems biologists to efficiently handle and interpret large scale mass spectrometry data. Therefore, future work consists of two main agendas. One part of the effort will go into developing consensus algorithms that could take clustered spectra to form consensus spectra. These consensus spectra then can be used for further processing pipelines used by systems biologists. Another interesting area to explore is parallelization of the algorithm on other architectures such as Cray XMT and Cell Processors. It would also be interesting to explore parallelization techniques on heterogeneous (GPU+CPU) architectures.
References [1] J. Hoffert, T. Pisitkun, G. Wang, F. Shen, and M. Knepper, “Quantitative phosphoproteomics of vasopressin-sensitive renal cells: regulation of aquaporin-2 phosphorylation at two sites,” Proc. Natl. Acad. Sci. U.S.A., vol. 103, no. 18, pp. 7159–7164, 2006. [2] X. Li, S. A. Gerber, A. D. Rudner, S. A. Beausoleil, W. Haas, J. E. Elias, and S. P. Gygi, “Largescale phosphorylation analysis of alpha-factor-arrested saccharomyces cerevisiae.,” J Proteome Res, vol. 6, no. 3, pp. 1190–7, 2007. ˜ [3] A. Gruhler, J. V. Olsen, S. Mohammed, P. Mortensen, N. J. FArgeman, M. Mann, and O. N. Jensen, “Quantitative Phosphoproteomics Applied to the Yeast Pheromone Signaling Pathway,” Molecular & Cellular Proteomics, vol. 4, pp. 310–327, March 2005. [4] J. D. Hoffert, T. Pisitkun, F. Saeed, J. H. Song, C.-L. Chou, and M. A. Knepper, “Dynamics of the g protein-coupled vasopressin v2 receptor signaling network revealed by quantitative phosphoproteomics,” Molecular & Cellular Proteomics, vol. 11, no. 2, 2012. [5] T. Cantin, D. Venable, D. Cociorva, and R. Yates, “Iii quantitative phosphoproteomic analysis of the tumor necrosis factor pathway,” J. Proteome Res., vol. 5, p. 127, 2006. [6] A. Beausoleil, M. Jedrychowski, D. Schwartz, E. Elias, J. Villen, J. Li, A. Cohn, C. Cantley, and P. Gygi, “Large-scale characterization of hela cell nuclear phosphoproteins,” Proc. Natl. Acad. Sci. U.S.A., vol. 101, p. 12130, 2004. [7] B. Zhao, T. Pisitkun, J. D. Hoffert, M. A. Knepper, and F. Saeed, “Cphos: A program to calculate and visualize evolutionarily conserved functional phosphorylation sites,” Proteomics, vol. 12, no. 22, pp. 3299–3303, 2012. [8] X. Jiang, M. Ye, G. Han, X. Dong, and H. Zou, “Classification filtering strategy to improve the coverage and sensitivity of phosphoproteome analysis,” Analytical Chemistry, vol. 82, no. 14, pp. 6168– 6175, 2010.
15
[9] X. Du, F. Yang, N. P. Manes, D. L. Stenoien, M. E. Monroe, J. N. Adkins, D. J. States, S. O. Purvine, D. G. Camp, II, and R. D. Smith, “Linear discriminant analysis-based estimation of the false discovery rate for phosphopeptide identifications,” Journal of Proteome Research, vol. 7, no. 6, pp. 2195–2203, 2008. [10] F. Saeed, T. Pisitkun, J. D. Hoffert, G. Wang, M. Gucek, and M. A. Knepper, “An efficient dynamic programming algorithm for phosphorylation site assignment of large-scale mass spectrometry data,” in Bioinformatics and Biomedicine Workshops (BIBMW), 2012 IEEE International Conference on, pp. 618–625, IEEE, 2012. [11] I. Beer, E. Barnea, T. Ziv, and A. Admon, “Improving large-scale proteomics by clustering of mass spectrometry data,” PROTEOMICS, vol. 4, no. 4, pp. 950–960, 2004. [12] A. M. Frank, N. Bandeira, Z. Shen, S. Tanner, S. P. Briggs, R. D. Smith, and P. A. Pevzner, “Clustering Millions of Tandem Mass Spectra,” Journal of Proteome Research, vol. 7, pp. 113–122, January 2008. [13] A. M. Frank, N. Bandeira, Z. Shen, S. Tanner, S. P. Briggs, R. D. Smith, and P. A. Pevzner, “Clustering millions of tandem mass spectra,” Journal of Proteome Research, vol. 7, no. 1, pp. 113– 122, 2008. [14] U. V. Catalyurek, J. Feo, A. H. Gebremedhin, M. Halappanavar, and A. Pothen, “Graph coloring algorithms for multi-core and massively multithreaded architectures,” Parallel Computing, vol. 38, no. 1011, pp. 576 – 594, 2012. [15] T. Majumder, M. Borgens, P. Pande, and A. Kalyanaraman, “On-chip network-enabled multicore platforms targeting maximum likelihood phylogeny reconstruction,” Computer-Aided Design of Integrated Circuits and Systems, IEEE Transactions on, vol. 31, pp. 1061 –1073, july 2012. [16] Y. Liu, B. Schmidt, and D. Maskell, “Parallelized short read assembly of large genomes using de bruijn graphs,” BMC Bioinformatics, vol. 12, no. 1, p. 354, 2011. [17] J. Riedy, H. Meyerhenke, D. Bader, D. Ediger, and T. Mattson, “Analysis of streaming social networks and graphs on multicore architectures,” in Acoustics, Speech and Signal Processing (ICASSP), 2012 IEEE International Conference on, pp. 5337–5340, IEEE, 2012. [18] A. Sarje, J. Zola, and S. Aluru, “Accelerating pairwise computations on cell processors,” Parallel and Distributed Systems, IEEE Transactions on, vol. 22, pp. 69 –77, jan. 2011. [19] F. Saeed, J. Hoffert, T. Pisitkun, and M. Knepper, “High performance phosphorylation site assignment algorithm for mass spectrometry data using multicore systems,” in Proceedings of the ACM Conference on Bioinformatics, Computational Biology and Biomedicine, pp. 667–672, ACM, 2012. [20] F. Saeed, T. Pisitkun, M. A. Knepper, and J. D. Hoffert, “An efficient algorithm for clustering of large-scale mass spectrometry data,” in Bioinformatics and Biomedicine (BIBM), 2012 IEEE International Conference on, pp. 1–4, IEEE, 2012. [21] D. L. Tabb, M. J. MacCoss, C. C. Wu, S. D. Anderson, and J. R. Yates, “Similarity among tandem mass spectra from proteomic experiments: detection, significance, and utility,” Analytical Chemistry, vol. 75, no. 10, pp. 2470–2477, 2003. PMID: 12918992. [22] D. L. Tabb, M. R. Thompson, G. Khalsa-Moyers, N. C. VerBerkmoes, and W. H. McDonald, “Ms2grouper: Group assessment and synthetic replacement of duplicate proteomic tandem mass spectra,” Journal of the American Society for Mass Spectrometry, vol. 16, no. 8, pp. 1250 – 1261, 2005. [23] S. R. Ramakrishnan, R. Mao, A. A. Nakorchevskiy, J. T. Prince, W. S. Willard, W. Xu, E. M. Marcotte, and D. P. Miranker, “A fast coarse filtering method for peptide identification by mass spectrometry,” Bioinformatics, vol. 22, no. 12, pp. 1524–1531, 2006. 16
[24] D. Dutta and T. Chen, “Speeding up tandem mass spectrometry database search: metric embeddings and fast near neighbor search,” Bioinformatics, vol. 23, no. 5, pp. 612–618, 2007. [25] F. Saeed and A. Khokhar, “A domain decomposition strategy for alignment of multiple biological sequences on multiprocessor platforms,” Journal of Parallel and Distributed Computing, vol. 69, no. 7, pp. 666 – 677, 2009. [26] F. Saeed, A. Perez-Rathke, J. Gwarnicki, T. Berger-Wolf, and A. Khokhar, “A high performance multiple sequence alignment system for pyrosequencing reads from multiple reference genomes,” Journal of parallel and distributed computing, vol. 72, no. 1, pp. 83–93, 2012.
17