A GENERALIZED MODEL FOR DETECTION OF DEMOSAICING CHARACTERISTICS Hong Cao and Alex C. Kot School of Electrical and Electronic Engineering Nanyang Technological University {hcao, eackot}@ntu.edu.sg ABSTRACT Detection of demosaicing characteristics based on correlation at pixel level is useful for image forensic purposes. In this paper, we propose a new model to detect the demosaicing characteristics based on the second-order derivative correlation. Without the influences of the uneven DC components in the three color channels, the new model can estimate both intra-channel and cross-channel correlation. Experimental results show efficacy of the proposed model.
with a period of 2 along both Y and Y axes. The quantity of G-filters is two times of R or B-filters because green component carries luminance information to which human eyes are more sensitive.
(a)
Index Terms— Image forensics, CFA, Demosaicing
Bayer CFA Pattern y
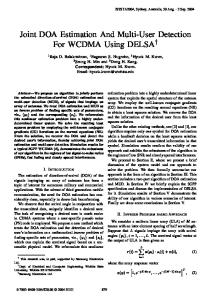
1. INTRODUCTION Color filtering and demosaicing are the common processes in the commercially available digital still cameras (DSC) to cost-effectively produce colors. As shown in Fig. 1(a), after photons pass through lens and optical filters, they are filtered by a color filter array (CFA) before the light intensity is measured by a sensor panel. Since CCD or CMOS sensors can only sense the luminance, a color filter is used on top of each sensor site (pixel) to mask out all undesired colors. In this way, a specific color can be measured. As only one color component is measured at each photo site (pixel), interpolation is used to estimate the missing color samples in order to produce a 3-color image and this interpolation is commonly referred as demosaicing. After demosaicing, the image further goes through postprocessing like color calibration, edge enhancement, gamma correction and JPEG compression before an end photo is created [13,14]. Arrangement of the color filters depends on the CFA patterns used. Available CFA patterns generally fall into two categories, primary color (RGB) type and complimentary color (CMY) type. Primary-color CFA is more popular because the color conversion step from CMY to RGB is not needed and usually some color fidelity is lost in this conversion. Complimentary-color CFAs work better in low-light condition and is more preferred for special cameras such as printing cameras. Among the various primary-color CFA patterns, Bayer pattern in Fig. 1(b) is the one most frequently adopted. The R, G and B filters of a Bayer pattern are periodically placed in a mosaic manner
978-1-4244-2571-6/08/$25.00 ©2008 IEEE
1513
x (b)
(c)
Fig. 1: (a) A Typical Processing Pipeline for Single-CCD Cameras and (b) A Bayer Color Filter Array (CFA) Pattern (c) Shifted Bayer Patterns
Each demosaicing method introduces specific correlations between an estimated sample and its surrounding sensor-measured samples. If the demosaicingdependant correlation can be accurately estimated, it is useful for forensic purposes such as source camera identification and image forgery detection. Several previous works [1-4] have attempted to characterize the correlation introduced by demosaicing and apply it to forensic research. However, in [1,2,4], the methods have an overly simplified assumption that all estimated pixels are equally correlated with their neighbors, which is not true in general. In [3], Swaminathan et al. propose an improved method, which divides the demosaiced pixels into 3 regions. For each region, demosaicing characteristic is separately estimated based on the assumption that missing samples in each region are demosaiced using the same formula. However, this approach only considers intra-channel pixel correlation and no cross-channel characteristics can be detected. In fact, many state-of-arts demosaicing methods rely on crosschannel information to achieve better demosaicing quality
ICME 2008
[5-12]. In this paper, we propose a generalized demosaicing model which takes into account of both intra-channel and cross-channel demosaicing characteristics. By estimating the parameters of the model from demosaiced pixels samples, the demosaicing characteristics are more accurately estimated. The rest of paper is organized as follows. In section 2, we describe a generalized demosaicing model and the parameter estimation. The experimental results are presented in section 3 and section 4 concludes this paper. 2. GENERALIZED INTERPOLATION MODEL AND PARAMETER ESTIMATION 2.1. Image Derivatives for Periodical Mosaic Lattice Available CFA patterns usually adopts periodical lattices with a period of 2u2 and demosaicing a missing sample in many cases is carried out in a certain direction. Hence, we first study a one-dimensional mosaic lattice shown in Fig. 2, where sensor samples (o) and demosaiced samples (¸) occupy alternate locations and each estimated sample is demosaiced along the t axis. The samples {F(k)} can be viewed as the discrete samples from a continuous function f (t), i.e. f �k for k ] (1) F �k ® otherwise ¯0 f �t
F � q � 3
F �q
F � q � 2
q �3
q�2
q �1
q
q �1
F � q � 2
q�2
F � q � 3
q�3
t
Fig. 2: One-dimensional periodical lattice (period = 2) for demosaicing. ‘o’s are sensor measured samples and ‘¡’s are demosaiced samples
It is reasonable to assume that the demosaiced samples are smoother and more predictable than the sensor samples. Here, the smoothness mathematically means that both left and right derivatives of f � x are equal and the Taylor expression below is applicable, f 1 � q f 2 � q 2 f 3 � q 3 (2) F � q � d F � q � d� d � d �" 1! 2! 3!
where q is an odd integer and we let the odd indices represent the demosaiced samples. F(q+d) is a sensor sample and q+d is an even integer. If only F(q-1) and F(q+1) are considered and with second-order approximation, we have the following 2 equations, (3) F � q � 1 F � q � f 1 � q � f 2 � q 2 (4) F � q � 1
f 2 �q
(6)
F � q � 1 � F � q � 1 � 2 F � q
From these two expressions, the odd-order derivative is directly computable from the known sensor samples. The demosaiced sample F(q) is inversely correlated with and directly computable from f 2(q). This formulation can be extended to higher-order and at the same time, a larger neighborhood of sensor samples need to be considered. For example, we need to include the sensor samples F(q-3) and F(q+3) in order to study the fourth-order approximation. 2.2 Grouping of Demosaiced Samples The 1D model described earlier is applicable to 2D cases if demosaiced samples in the same direction can be properly grouped. The actual demosaicing direction depends on neighborhood patterns and four possible patterns for the Bayer CFA are shown in Fig. 3. In Green channel, each missing sample has 4 direct neighbors as sensor samples in Fig. 3(a). In Red and Blue channels, the missing samples share 3 patterns in Fig.3 (b)–(d). y u
x (a)
(c)
(b)
v
(d)
Fig. 3 Four neighborhood patterns for Bayer CFA, where sensor samples are denoted by “o” and demosaiced sample is “¡” (a) four direct neighbors (b) four corner neighbors (c) two vertical neighbors (d) two horizontal neighbors ((a) exists for G channel only and (b-d) for R and B channels)
F � q � 1 F � q � 1
or equivalently, (5) f 1 � q � F � q � 1 � F � q � 1 2
F �q � f 1 �q � f 2 �q 2
1514
For patterns (c) and (d), the demosaicing directions are fixed as the nearest pairs of sensor neighbors are either vertically or horizontally arranged. Therefore, the estimation of partial second-order derivatives f xx or f yy is studied for these f
yy
two
groups,
where
f xx
w 2 f � x, y dx 2
,
w 2 f � x, y dy 2 and f � x, y is a continuous function
of the demosaiced image. For patterns (a) and (b) in Fig. 3, ambiguity arises as each missing sample can be interpolated along either one of the two axes or as an average along both axes. Correspondingly, we divide the demosaiced samples into 3 groups, i.e. X, Y and OXY for pattern (a) and U, V and OUV for pattern 3(b) by using a similar method in [3]. In each group, the demosaicing direction is known and we assume the same demosaicing formula is used. For groups X, Y, U and V, we study the estimation of f xx , f yy , f uu and f vv . For groups OXY and OUV, we study the estimation of
�f
xx
�f
yy
2 and
�f
uu
� f vv
2.
2.3. Correlation Model and Parameter Estimation
Previous work [1-4] uses pixel-based correlation models to study the demosaicing characteristics. However, these models can hardly be extended across boundaries of color channels because the DC levels of the 3 color channels are essentially different. We propose a correlation model based on the second-order derivatives. Without the DC components, cross-channel correlations can be more accurately estimated. Let Id be a demosaiced image and S be pre-processed sensor samples of the Bayer CFA given below as § ^r , G , B`11 ^ R, g , B`12 ! · § r11 g12 ! · ¨ ¸ ¨ ¸ S ¨ g 21 b22 ¸ ¸ , I d ¨ ^ R, g , B`21 ^ R, G , b`22 ¨¨ ¸ ¨ # ¸ % # % ¸¹ © ¹ © where capital R, G and B represent the demosaiced samples. The actual second-order derivatives along the x-axis, e.g. I gxx for demosaiced green samples of Id is computed using (6). Correspondingly, the second-order derivatives of sensor samples in S, e.g. Sxx are computed on the down-sampled S using (6) and the equivalent formula is given below (7) S xx � i, j S � i � 2, j � S � i � 2, j � 2 S � i, j For every demosaiced sample in a group, e.g. I gxx � i, j , a prediction equation is written as (8) wgx1S xx � i � 2, j � ... � wgxn S xx � i � 2, j
I gxx � i, j
4.
Solve w
�
arg min Qt w k � b t wk
2
.
The cross validation in the above steps ensures that the solution w has good generalization property. 3. EXPERIMENTS AND RESULTS 3.1. Prediction Accuracy In the first experiment, we reconstruct the “pepper” image with 10 reported demosaicing algorithms and the demosaicing correlation is studied for each demosaiced image using the proposed method with three different orders and the method in [3]. We then compare the prediction accuracy of the different methods and the average prediction errors of the G channel is shown in Fig. 4. The results show that our proposed model re-estimates the missing samples more accurately for majority of demosaicing methods which utilize cross-channel information. For methods which do not use cross-channel information to demosaic the Green channel, e.g. Bilinear, Bicubic [1] and Cok’s [12] methods, Swaminathan et al. method [3] performs better. Increasing the order of the Taylor expression for the proposed scheme has slightly adverse effects on the estimation accuracy because most demosaicing methods emphasize on the sensor samples in the 3u3 neighborhood of a missing sample.
where n is chosen as 13 based on a diamond estimation area and {wgx1 ,…, wgxn} are the weight parameters. Represent all linear equations for a demosaicing group in a matrix form, we have (9) Qw b where ª I xx � i , j º ª S xx i � 2, j ª wgx1 º � 1 1 " S xx � i1 � 2, j1 º» « g 1 1 » « « » » » w « # » b « Q « # % # # « » « » «w » xx xx xx « I g � im , jm » «¬ S � im � 2, jm " S � im � 2, jm »¼ ¬ gxn ¼ ¬ ¼
Q \ mun and {(i1,j1),…,(im,jm)} are indices of the demosaiced samples in the group. Since the demosaiced image Id will be further distorted in the post-processes, both Q and b are subject to changes. The problem is formulated as total least square (TLS) equations [16] and w is solved as a truncated TLS solution with the steps below, 1. Randomly divide all demosaiced samples of a group into training and testing samples. Form the matrices Qn, bn, Qt and bt based on the division; 2. Perform SVD for compound training matrix, >Qn bn @ U ¦ VT , where U, V are singular matrices;
3.
Partition V
ª V11 «V ¬ 21
V11 \ nuk and
wk
† � V12 V22
V12 º for each k[1, n], where V22 »¼ 1u n �1� k . Then compute V22 \ �
T � V12 V22 V22
2 2
;
1515
Pepper
Fig. 4 Comparison of Average Prediction Errors per Pixel for Various Demosaicing Methods Using Image “Pepper”
3.2. Detection of Bayer Pattern after Post-Processes In this experiment, we select 50 commonly used color images in literature and the sizes of these images are approximately 512u512. The 50 images are first demosaiced with three selected methods according to one of the four Bayer patterns in Fig. 1(b) and (c). Afterwards, we let the demosaiced images go through six post-processes including quantization, color mixing, gamma correction, edge enhancement, adding Gaussian zero-mean noise and lossy JPEG compression. As the post-processes possibly distort the demosaicing regularity, we attempt to reveal the correct Bayer CFA pattern from the post-processed images. To
achieve this task, we compute the average prediction error based on all the 4 Bayer patterns and the pattern which gives the least prediction error is regarded the correct choice. The order of Taylor’s expansion is set as 2. The detection error rates for the separate color channels and the combined channels are reported in Table 1.
4. CONCLUSION We propose a generalized model for detection of demosaicing characteristics in this paper. Instead of studying the intra-channel pixel correlations, we advocate the importance in the correlation of second-order derivatives so that the cross-channel correlations can be modeled as well as the intra-channel correlations. Experimental result shows that the proposed method can be utilized to give a reasonably accurate detection of Bayer pattern by utilizing the cross-channel information. Our results show that demosaicing regularity is still detectable for sophisticated demosaicing algorithm and even after strong postprocessing.
Table 1 Error Percentage (%) in Revealing the Correct Bayer CFA Pattern after Common Post-Processing Demosaic Method Bicubic [1]
Chang [5]
Hamilton [8]
Processing Type 1 2 3 4 5 6 1 2 3 4 5 6 1 2 3 4 5 6
G 14 38 12 6 16 12 6 4 4 16 4 16 0 0 0 24 2 30
channels than that for the luminance channel and this introduces more quantization errors in the two chrominance channels. And the chroma sub-sampling [15] in JPEG compression also significantly distorts the demosaicing regularity in the R and B channels.
Proposed Method R and B G, R, B 0 0 0 0 0 0 36 14 8 8 62 20 58 8 56 14 56 8 70 44 60 24 66 28 0 0 0 0 0 0 14 26 8 6 50 46
5. REFERENCES
Type of Post-processing: 1. Quantization to [1,2,…,255]; 2. Color mixing or color calibration 3. Edge enhancement using unsharp mask (PSNR = 30 dB); 4. Gaussian zero mean noise (PSNR = 30 dB); 5. Gamma correction (J=2.2); 6. JPEG compression (Q = 80, Chroma Subsampling 2u2)
The results show our proposed method works reasonably well for both cross-channel demosaicing methods [5, 8] and simple intra-channel method like Bicubic under light post-processes, e.g. quantization. We attribute this to the accurate modeling of the overall demosaicing characteristics. The largest observed error rate of the proposed method by combining R, G and B channels is 46% under lossy JEPG compression, which is still much smaller than 75% that corresponds to cases of no demosaicing regularity. The results show that demosaicing regularity is still detectable by our method for sophisticated demosaicing method [5] which has a refinement step at the end and even after severe post-processing. The detection results based on separate channels show that G channel tends to give more reliable result than R-B channels especially after JPEG compression (processing type = 6). One possible reason is that the percentage of sensor samples in G-channel is two times of that in R or B channel; hence the demosaicing regularity is better detected in G channel. Another reason is that some post-processing like lossy JPEG compression introduces more distortions in the R and B channels than in G channel. Lossy JPEG compression usually uses larger quantization steps for the chrominance
1516
[1] A.C. Popescu, H. Farid, “Exposing Digital Forgeries in Color Filter Array Interpolated Images”, IEEE Trans. on Signal Processing, vol. 53-10, pp. 3948-3959, 2005 [2] S. Bayram, H. Sencar, N. Memon, I. Avcibas, “Source Camera Identification Based on CFA Interpolation,” In. Proc. of ICIP, vol. 3, pp. III-69-72, 2005. [3] A. Swaminathan, M. Wu, K. J. R. Liu, “Nonintrusive Component Forensics of Visual Sensors Using Output Images,” IEEE Trans. on Information Forensics and Security, vol. 2-1, pp. 91-106, 2007 [4] Y. Long, Y. Huang, “Image Based Source Camera Identification using Demosaicing,” In Proc. of IEEE 8th Workshop on Multimedia Signal Processing, pp. 419-424, 2006 [5] L. Chang, Y.P. Tan, “Effective Use of Spatial and Spectral Correlations for Color Filter Array Demosaicing,” IEEE Trans. on Consumer Electronics, vol. 50, pp. 355-365, 2004 [6] B. K. Gunturk, Y. Altunbasak and R. M. Mersereau, “Color Plane Interpolation using Alternating Projections,” IEEE Trans. Image Processing, vol. 11, pp. 997-1013, 2002 [7] R. Kimmel, “Demosaicing: Image Reconstruction from CCD Samples,” IEEE Trans. Image Processing, vol. 8, pp. 1221-1228, 1999 [8] X. Wang, W. Lin, P. Xue, “Demosaicing with Improved Edge Direction Detection”, In Proc. of ISCAS, vol. 3, pp. 2048-2051, 2005 [9] J.F. Hamilton, Jr.,J.E., Adams,,, “Adaptive Color Plane Interpolation in Single-Sensor Color Electronic Camera”, U.S. Patent 5,629,734, 1997 [10] C.A. Laroche, M.A. Prescoot, “Apparatus and Method for Adaptively Interpolating a Full Color Image Utilizing Chrominance Gradients,” U.S. Patent 5,373,322, 1994 [11] Freeman, T. William, “Median Filter for Reconstructing Missing Color Samples”, U.S. Patent 4,724,395, 1988 [12] D. R. Cok, “Signal Processing Method and Apparatus for Producing Interpolated Chrominance Values in a Sampled Color Image Signal,” U.S. Patent 5.373,322, 1994 [13] R. Ramanath, W.E. Snyder, Y. Yoo, M.S. Drew, “Color Image Processing Pipeline”, IEEE Signal Processing Magazine, vol. 22-1, pp. 3443, 2005 [14] J. Adams, K. Parulski, K. Spaulding, “Color Processing in Digital Cameras,” IEEE Micro, vol. 18-6, pp. 20-30, 1998 [15] “JPEG Chroma Subsampling” tutorial. Available at: http://www.impulseadventure.com/photo/chroma-subsampling.html [16] P. C. Hansen, Rank-Deficient and Discrete Ill-Posed Problems, SIAM, Society for Industrial and Applied Mathematics, 1998