A Framework for Visual Characterization of Number Theoretic Problems in Cryptography Ashok Subramanian, Priyank Singh Jaypee Institute of Information Technology University A-10 Sector 62, Noida, India Abstract Learners often find it difficult to grasp the workings of complex algorithmic problems by merely studying their theoretical aspects. This dissertation presents a visual characterization framework that learners can use for visualizing the steps involved in solving user defined instances of a problem. As a reference, this framework has been applied to number theoretic problems used in cryptography. It provides the algorithm analyst with a simple yet effective complexity analysis and comparison tool. This enables the user to analyze the complexities of individual algorithms as well as compare the complexities of similar algorithms to select the optimal one for the input data range. Lastly, it provides an object oriented code model which can be used by developers to apply the framework for characterizing other algorithms or to extend parts of it for different applications.
I.
INTRODUCTION
Visual characterization is a mechanism used to visually and vividly present the description or essential features of a system. It has been previously applied to several domains such as learning [1 and 3], medicine [5], mathematics [3 and 4], and nano technology [2] to name a few. This dissertation presents a visual characterization framework that has been applied to the field of number theoretic problems commonly used in cryptography. The theoretical aspects of these problems have been referred from the Handbook of Applied Cryptography [15]. For each problem, the framework provides a visualization of the steps followed while solving a user defined problem instance. This enables learners to gain a better understanding of the workings of the algorithm. The framework also provides a complexity analysis tool which can be utilized to analyze the performance of algorithms for a range or set of input data. Further, for a set of similar problems such as factoring algorithms a complexity comparison utility has been developed. This allows the user to compare the performance of various algorithms on the defined problem instances. Apart from being used by learners and analysts, this object oriented framework is open source and can be utilized by developers to create applications based on number theoretic problems. This allows the modern developer to directly utilize this framework without facing the painstaking task of porting applications and implementations from other platforms into their own. The object oriented model allows the developer to apply the same framework to different algorithms and also to utilize sections of the code for different applications.
II.
LITERATUE SURVEY
There are a variety of tools that visualize algorithms using several different techniques. However, there are hardly any tools for the visual characterization of algorithms. There is a class of generic visualization software that is used for mathematical simulations and may also be used for complexity analysis of algorithms. Some of the software include MATLAB [6] and Mathematica [7]. These are very powerful commercial visualization tools however they have not been specifically developed for visual characterization. Hence, they may be utilized for complexity analysis by visualizing performance graphs but this requires the user to gain an in depth understanding of the software and learn a new programming language. Reference [8] provides an exhaustive survey of tools and techniques utilized for visualizing algorithms. It discusses a genre of tools that abstract the inner workings of programs and visualize the high level algorithmic behavior. Tools such as Zeus [9], TANGO [10] and Polka [11] operate upon the source code written by the programmer and after suitable abstractions provide a graphical trace of the execution which is then translated to a
higher view. On the same lines is the visualization tool Graphviz [12] which is used for viewing and manipulating large graphs has been used for visualizing abstraction of algorithm source codes. These tools are quite efficient for algorithm source code abstraction visualization, however they lack the simplistic and context specific utility of a visual characterization tool. There are a handful of implementations and tools specially designed for number theoretic problems. KASH – 3 [13] is a tool based on algebraic number theory. It performs a lot of sophisticated operations for computations in number fields and ideals in number fields. The tool is based on a console based design which requires the user to enter a long string of commands to utilize these powerful features. The users shall also have to familiarize themselves with a PASCAL like programming language to develop programs using this tool. This makes it quite complex to use and it also does not provide any utilities for complexity analysis or comparison. PARI/GP [14] is a widely used computer algebra system designed for fast computations in number theory. Some of the topics include factorizations, algebraic number theory, elliptic curves etc. It also contains a large number of other useful functions to compute with mathematical entities such as matrices, polynomials, power series, algebraic numbers and transcendental functions. PARI is also available as a C library to allow for faster computations. Users can utilize the existing number theoretic library and write related code. However, the library is based in C and does not offer the modern developer with any simple to use object oriented options. Also, naïve learners will have to write C codes to learn from the PARI library and they still would not be able to understand the inner workings of the algorithms or study the complexity analysis without writing a lot of code. Majority of the surveyed visualization tools are very effective in their own right but their application as visual characterization tools must not be deemed as appropriate. The existing number theoretic utilities also fare in the same way. They are good resources for expert programmers but are not very user friendly for learners or analysts who simply want to analyze and understand algorithms. The major short comings of the existing implementations are that they require the user to be proficient in one or the other form of programming in order to use the features provided. Further, complexity analysis is one feature which is needed by algorithm analysts and developers and it is found wanting in all of the implementations. The inclusion of an object oriented uniform model for the understanding and analysis of these algorithms shall also be a useful addition. The framework presented in this dissertation takes into account these short comings and presents a unique approach towards facilitating the simplicity of understanding which is required by a naïve learner, the instant user friendly approach required by an analyst as well as a source code modeled on principles of object oriented programming required by developers to extend the current framework or utilize segments of it.
III.
THE VISUAL CHARACTERIZATION FRAMEWORK
A. Visualizing the working of algorithms
The primary utility that the framework provides to the learner is the visualization of the workings of an algorithm. This is a dynamic visualization in which the user feeds the framework with the details of the input instance of the problem and it delineates the number of steps which are required to solve the given instance and along with the details of each and every step.
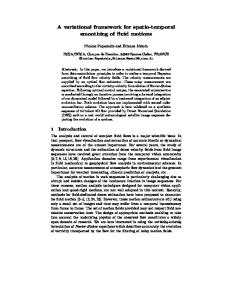
Fig. 1. Visualization of the steps required to solve an input instance of the Pollards Rho Algorithm
The example shown in Figure 1 is a visualization of the steps required in factoring the number 455459 using the Pollards Rho algorithm. The learner can feed in different integers to be factored and can correlate the steps shown by the framework to the behavior of the algorithm in theory and can gain a deeper understanding.
Fig. 2. Visualization of the steps required to solve an input case of the Lattice Based Subset Algorithm
Another example in figure 2 shows the visualization of the workings of the Lattice based subset algorithm. The framework takes the input instance 15,45,26,48,78,9512,45,48,2,59,48,12,6,4,8 and applies the algorithm to search for the correct utilization to reach the total of 200. Each and every relevant step in the solution of the problem has been presented to the user and this visual method of presentation enables the learner to quickly grasp the workings of the algorithm. It also enables analysts or developers who are working on or developing similar problems to test their implementations by analyzing the solution steps presented.
B. Complexity analysis of algorithms One of the major drawbacks of the existing implementations was the lack of a simplified mechanism to perform complexity analysis of algorithms. Invariably the implementations required the user to write a lot of code to perform simple complexity analysis. The framework provides an extremely simple and effective method for performing complexity analysis of algorithms. To perform complexity analysis the user simply has to enter either the range of the input data upon which the tests are to be made or a customized set of data and the complexity graph is generated for analysis. Figure 1 shows the complexity analysis graph of the Pollards Rho Algorithm for the range of integers from 5 to 100. The framework automatically filters the cases which do not meet the prerequisite conditions of the algorithm and displays only the valid ones. The algorithm analyst can utilize the complexity analysis utility to gain a deeper understanding of the workings of an algorithm or to judge whether an algorithm would be suitable for a certain application. This dynamic visualization can be altered by changing the graph type to a variety of options. Figure 4 displays a few examples of other graph types available for complexity analysis.
Fig. 3. Complexity analysis of the Pollards Rho Algorithm
Sometimes the complexity analysis data does not directly yield any helpful information and the user may wish to see a broader view. The framework provides the user with a graph refining option based on averaging techniques which are applied to the graph contents. This smoothens the large variations in the data and allows the user to see the macro view of the data and draw conclusions. The results of the refining process are shown in Figure 5. If the user has to analyze the complexity of a very large range of data, the need to focus in on smaller sections of that range arises. This can be done by zooming in and out on the performance graph and also by selecting portions of the graph which will be automatically zoomed up to fit to the screen size.
Fig. 4. Variety of graphs available for complexity analysis of algorithms
Fig. 5. Refining of the complexity graph
C. Complexity comparisons of multiple algorithms Algorithm analysts and developers are required to choose between one of several algorithms for an application based on the performance of these algorithms. Utilizing the same simple yet effective approach described in the previous section the user can feed a range of data to the framework and a drawn to scale comparison of the complexities of the various algorithms is presented. This helps the user to decide which algorithm shall be more suited to the data range that the application requires. Figure 6 shows the complexity comparison for five modulo square root algorithms.
Fig. 6. Complexity analysis of modulo square root algorithms
D. Object oriented open source model The framework presented in this dissertation has been developed in Microsoft Visual C# .NET and as been applied to a set of fourteen number theory problems which are classified into four major categories. One of the main strengths of this framework is the open source object oriented code. The open source code acts as much more than a mere library of functions in C#. It makes it very useful for developers to utilize each and every part of this model individually, in groups and also as a single black box. Figure 7 shows the application of this model to the implementation of the Pollards Rho algorithm.
Fig. 7. Application of the object oriented model to an implementation of the Pollards Rho algorithm
A developer can utilize this model in several ways. The NumberTheoreticUtilities class can be used as a standalone component to access the static functions within. The file can simply be added to a new project and the functions can be used directly in the form of a library.
The Pollards Rho algorithm class and the NumberTheoreticUtilities class can be used together for an implementation of the Pollards Rho algorithm. The develop simply has to create an instance of the Pollards Rho class and call the required library functions to factorize a single integer, a set of integers or a range of integers. The ChartController is a control which has been developed as a component in the windows control library. This allows developers to utilize its powerful graph viewing and manipulation features for other puposes by using three or four lines of code. The developer simply has to pass the data to be plotted along with some minor details and the graph is automatically drawn to scale in the given area. The ChartController can also be used with the user interface model of the windows form to create similar implementations for any number of algorithms. IV.
CONCLUSION
We have surveyed different types of visualization tools as well as implementations and discussed their application for visual characterization algorithms. The shortcomings found in this survey have been highlighted and a framework for visual characterization of number theoretic problems overcoming these shortcomings has been presented. The framework provides several utilities from the perspective of a learner, a developer and an analyst. It allows the learner to understand the workings of an algorithm by visually presenting the steps involved in solving an input instance. Analysts can analyze the complexities of algorithms individually and can also compare complexities of similar algorithms without having to write any lines of code. Lastly, it provides an object oriented model which can be used by developers to apply the framework for characterizing other algorithms or to extend parts of it for different applications.
REFERENCES
[1] Piburn, Michael D.; Reynolds, Stephen J.; McAuliffe, Carla; Leedy, Debra E.; Birk, James P.; Johnson, Julia K., “The Role of Visualization in Learning from Computer-Based Images. Research Report”, International Journal of Science Education, v27 n5, p513-527, Apr 2005 [2] V. Khvatkov, R. Kadushnikov, V. Nesh and I. Bleiweiss, “Automated Visual Characterization and Analysis of Nano tube Materials”, NSTI Nanotechnology Conference and Trade Show - Nanotech, 2006 [3]
N. Presmeg, “Research on Visualization in Learning and Teaching Mathematics”, Illinois State University, unpublished
[4] A. Geschke, U. Kortenkamp, B. Lutz-Westphal, D. Materlik, "Visage – Visualization of Algorithms in Discrete Mathematics", ZDM, Vol. 37 (5), December 2005 [5] I. Manssour, C. Freitas, "Collaborative Visualization in Medicine", WSCG 2000 – The 8th International Conference in Central Europe on Computer Graphics, February 2000 [6]
“MATLAB”, http://www.mathworks.com/
[7]
“Mathematica”, http://www.wolfram.com/products/mathematica/index.html
[8] Report
C.Demetrescu, I. Finocchi, G. Italiano, S. Naher, "Visualization in Algorithm Engineering Tools and Techniques", Alcom-FT Technical
[9] M.H. Brown. "Zeus: a System for Algorithm Animation and Multi-View Editing", In Proceedings of the 7-th IEEE Workshop on Visual Language, pages 4-9, 1991 [10]
J.T. Stasko, "Animating Algorithms with X-TANGO", SIGACT News, 1992
[11] J.T. Stasko, "A Methodology for Building Application-Specific Visualization of Parallel Programs", Journal of Parallel and Distributed Computing, 1993
[12] J. Ellson, E. Gansner, E. Koutsofios, S. North, and G. Woodhull, "Graphviz and Dynagraph – Static and Dynamic Graph Drawing Tools", AT&T Labs – Research
[13]
Institue of Mathematics Berlin, “KASH -3”, http://www.math.tu-berlin.de/~kant
[14]
“PARI/GP”, http://pari.math.u-bordeaux.fr/
[15]
A. Menezes, P. Oorschot and S. Vanstone, "Handbook of Applied Cryptography", p89 - 124, CRC Press, Inc