A comprehensive method for the elastic calculation of the twopoint wheel-rail contact J. SANTAMARÍA, E. G. VADILLO and J. GÓMEZ Department of Mechanical Engineering. University of the Basque Country. Bilbao (Spain) Email:
[email protected] This work shows the method developed to solve the wheel-rail contact problem via a look-up table with a three-dimensional elastic model. This method enables introduction of the two contact point effect on vehicle movement using three-dimensional analysis of surfaces including the influence of the angle of attack. This work presents several dynamic simulations and studies the impact that the introduction of the two contact points on three dimensions has on wear indexes and derailment risk against traditional bidimensional analysis. Furthermore, it studies advantages and disadvantages of using a look-up table against an on-line resolution of the problem. Keywords: railway dynamics; wheel-rail contact; multipoint contact;
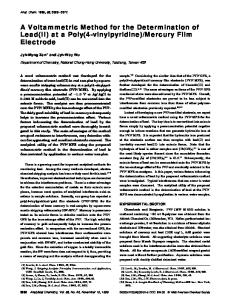
1 Introduction In railway dynamics the wheel-rail contact problem is frequently resolved in two dimensions [1], disregarding the influence of the angle of attack on the lateral wheelset displacement. Nevertheless, this parameter can sometimes reach important values (e.g. on very sharp underground or tram line curves), whereby they could influence localization of the contact point, that moves away from the vertical plane that contains the centreline of the wheel (fig. 1). On the other hand, using an elastic contact model between wheel and rail has become generalised in recent years, leading to the abandonment of the rigid contact hypothesis. This enables simultaneity of two differentiated contact points on different areas of the wheel profile [2]. The distribution of forces between the contact points depends on the elasticity in the contact areas [3].
4. 00
3. 60
3. 20
2. 80
2. 40
2. 00
1. 60
1. 20
0. 80
0. 40
40 35 30 25 20 15 10 5 0
0. 00
15
30
60
100
150
200
300
750
Curve radius (m)
Distance from middle plane (mm)
Lead flange contact point
5.00 4.00 3.00 2.00 1.00 0.00 -1.00 5000
Angle of attack (º)
Angle of attack versus curve radius
Angle of attack (º)
Figure 1 (left). Angle of attack of the first wheelset of a bogie as a function of the curve radius, for 1 m. gauge. Figure 1 (right). Distance from the vertical plane through the centreline of the wheel to the contact point as a function of angle of attack, with y=4.8 mm. UIC 54 rail profile and DT14 wheel profile used for both cases.
The elastic calculation between wheel and rail is far more expensive in computational terms than rigid contact, even more so with three-dimensional analysis. This three-dimensional analysis usually slows down the vehicle dynamic simulation considerably. However, a look-up table with contact solutions for specific wheelset positions relative to the track can be carried out, as in the method proposed in this paper. With elastic contact there are four wheelset degrees of freedom (dofs) defining the relative position of the wheels on the track (lateral wheelset displacement ‘y’, angle of attack ‘α’, vertical displacement ‘z’ and roll angle ‘φ’). Therefore the table depends on these four variables, using discrete calculation. A few years
ago, the generation and use of a tetradimensional table with a large amount of data on each of the four dimensions would have been impossible due to the memory and calculation time required. However, the on-going improvement of IT system capacities make this option possible nowadays. 2 Description of the method 2.1 Rigid wheel-rail contact approach The rigid-contact hypothesis is based mainly on two approximations: 1) That the elastic deformation of the wheel and the rail is insignificant, allowing both of them to be treated as rigid solids. 2) That contact is maintained between the wheel and the rail throughout the trajectory, ignoring the possibility of the wheel occasionally becoming separated from the rail. Given the wheel and rail profiles, for each specific pair of values for the wheelset degrees of freedom ‘y’ and ‘ α’, only one specific pair of values (‘z’, ‘ φ’) satisfies the rigid contact condition [4] for both wheels (rigid contact hypothesis). Degrees of freedom ‘z’ and ‘ φ’ , and other contact parameters required for the simulation phase, are obtained as functions of ‘y’ and ‘ α’ using an iterative algorithm as described in [4]. It is possible, therefore, to create a table of the contact parameters for discrete values of the independent dof. y φ
z
Figure 2. Rigid contact approach: given values for ‘y’ and ‘ α’, a series of iterations pr ovides the values of ‘z’ and ‘φ’ that correspond to single contact points in both wheels.
2.2 Elastic wheel-rail contact approach The elastic-contact hypothesis takes into account the existence of contact patches between the bodies, due to their elasticity; they are no longer regarded as rigid solids. The ‘z’ and ’ φ’ degrees of freedom which were dependant in the rigid-contact hypothesis now become independent, since the condition that the contact between the wheel and the rail occurs at a point no longer holds. Generally speaking, this means that if certain values are established for the four independent dof, single-point contact will not generally occur, but rather, there will be one or more interpenetration areas between each wheel and rail. The method presented here seeks the interpenetration areas produced for a specific combination of wheelset dofs and, based on the Hertz theory [5], calculates the normal force between the two bodies that would produce said interpenetration on each of the contact patches. The phenomenon of a double contact point between wheel and rail can be resolved simply, identifying the two interpenetration areas and calculating the normal forces separately (fig. 3). The search for the contact patches between the wheel and the rail, and the calculation of the corresponding normal forces, is relatively expensive in computational terms. For this reason, to reduce the calculation times, the problem is normally solved in two dimensions, assuming that the contact patches are located on a vertical diametric section of the wheel. This is equivalent to saying that the influence of the yaw angle ‘α’ on the location of the contact patches is ignored. By ignoring this degree of freedom, the location and dimensions of the contact patches depends only on the values of ‘y’, ‘z’ and ‘ φ’.
Single contact patch
First contact patch
No contact patch
Second contact patch
Figure 3a. Single-point contact
Figure 3b. Two-point contact
Figure 3c.No point contact (normal force=0)
To solve the two-dimensional elastic-contact problem, the wheel profile is located with respect to the rail profile according to the values of the three dof mentioned above. To model the profiles, discrete points are used (separated by 0.5 mm to 3 mm), and spline equations are used to interpolate between these points (fig. 4a). The profile of the wheel is scanned to delimit the zone or zones where interpenetration occurs. In each of these zones, by using the cubic spline curves, the maximum indentation that occurs in the direction normal to the wheel profile is calculated (fig 4b). Using the Hertz theory [5], and given the value of maximum indentation, the radii of curvature of the solids at the contact point and the elastic constants of the material, the normal force that would have to be applied in order to produce such indentation can be calculated. The relationship between force and indentation is non-linear, and is governed by the wellknown expression: N = C · δ 3/2, where N is the normal force, δ is the indentation and C is a constant that depends on the curvatures and the elastic constants of the bodies. Wheel profile
Rail profile
Indentation
Figure 4a. Wheel and rail profiles are defined by discrete points
Figure 4b. Indentation of the contact patch
During the dynamic simulation phase, once the normal forces have been obtained for each contact patch detected, the remaining forces and the accelerations along all degrees of freedom of the model are calculated. This includes the dof ‘z’ and ‘ φ’ of the wheelset, which are now independent of the others and are integrated over time in the same way as the other dof. The values of the degrees of freedom are determined for subsequent time steps using a numerical integration algorithm. The process of finding the contact patches and obtaining the normal forces is repeated subsequently. 2.3 Elastic wheel-rail contact calculation in three dimensions As illustrated in figure 1, the contact between the wheel and the rail may occur at a point some distance from the vertical diametric section if the angle of attack of the wheelset is significant. This will generally occur when the vehicle is on a tight bend. In such cases, a three-dimensional search on the wheel to locate the contact patches will produce more realistic results than a two-dimensional analysis. In this way the second contact point problem in the flange area ahead or behind of the vertical plane that contains the centreline of the wheel can be tackled (fig. 5).
Vertical plane that contains the centerline of the wheel
Wheel
T Tangential creep force
V Rail Rail
Angle of attack
Lead flange contact
Lead flange contact
α
V
Figure 5. Lead flange contact when the influence of the angle of attack is taken into account. Creepages and creep forces may increase significantly from those obtained through a 2-D contact analysis.
The following procedure is used to locate the contact patches. The wheel is first swept in a longitudinal direction to obtain a certain number of vertical sections to be analysed (fig 6). It has been found that even in the most unfavourable cases, checking an area D/8 wide (where D is the diameter of the wheel) on each side of the wheel centre is enough to detect even the most distant contact patches. The 3-D calculation implies transformations and rotations of the defining points of the profiles as a function of the yaw angle. Having calculated the new profile-defining points, the analysis then proceeds as in the two-dimensional elastic case. The centre of each contact patch will be in the vertical section where the maximum indentation occurred, and the normal force corresponding to this maximum value is calculated.
α
D/8 dx
Figure 6. Longitudinal scan of the solids and the contact patch, used during analysis of elastic contact in three dimensions.
Since the region to be scanned is much larger than in the two-dimensional case, the dynamic calculations for the vehicle take much longer. The method presented in this paper proposes creating a table with the results obtained for discrete combinations of the 4 dof involved in the 3-D problem. This table is therefore four-dimensional, with indices ‘y’, ‘ α’, ‘z’ and ‘ φ’, and stores the values of the contact parameters (fig 7). The data that is strictly necessary for the subsequent dynamic simulation is the number and position(s) of the contact point(s), and the contact angles, indentations and curvatures of each of them. The normal forces could be calculated from the indentations and the curvatures, but in order to speed up the subsequent dynamic calculations, they are also stored in the look-up table. Since they may be of interest, the dimensions of the contact ellipse are also stored. It is important to realise that these dimensions do not correspond to the interpenetration regions obtained by superimposing the two rigid solids, due to the elastic deformation of the bodies, and they have to be derived using the Hertz theory [5].
Number of contacts in each wheel
y α z
x,y,z coordinates of each contact centre
Elastic 3-D contact table
φ
Contact slope Normal force Indentation of each contact Size of the elliptical contact patches Curvatures of the solids at each contact
Figure 7. Inputs and outputs of the look-up table with the elastic 3-D contact data
In order to include all the possible positions that the wheelset could reach during a dynamic simulation, it is necessary to calculate the wheel-rail contact data for a large amount of cases. During the simulation, the elastic contact information at each integration step is obtained by interpolation of the adjacent data in the table. The crucial point is that the number of discrete positions calculated in the tables has to be enough to detect the two-point contact cases if they can happen. For example, when the wheelset moves laterally and the contact point jumps from the tread to the flange of the wheel, two-point contact will probably occur for certain lateral displacements and angles of attack (‘y’, ‘ α ’) of the wheelset. The size of the table should be adequate in order to include enough realistic cases of two-point contact for these displacements. In this way, their interpolation will be possible during the simulation. 3. Efficient calculation of the elastic contact table Having established the number of discrete positions that will be calculated for each degree of freedom, and the range of values to be used, the elastic contact problem has to be solved for each combination of ‘y’, ‘α’,’z’ and ‘ φ’. Th e results are stored in the elastic contact table. If the number of combinations is very high, the time required to calculate the table entries might be so high that the advantages of the proposed method are lost. In order to speed up the table calculations, a number of techniques are used, including the use of symmetries and their corresponding relationships (which allows just one half of the wheel to be scanned) and splitting the scan into two phases: the search phase, with a large scan step, to detect the regions of contact, and the fine scan, in which the maximum indentations are calculated using smaller steps. However, the technique that probably contributes most to the efficiency of the method described here is the use of the results obtained for the rigid-contact problem as a base for the elastic-contact calculations. The values of indentation are very small, since the wheel and the rail are made of steel and their stiffness are high. As a result, for given values of ‘y’ and ’ α’, the values of the dof ‘z’ and ’ φ’ derived from the rigid-contact hypothesis (zero indentation) are very similar to the values obtained using the elastic-contact hypothesis. The ranges of possible values for these dof are small if we start from the position of the wheelset obtained from the rigid-contact hypothesis. However, as the wheelset is displaced laterally, the dof ‘z’ an d ‘φ’ show greater variations. In figure 2, it can be seen that the values of ‘z’ and ‘ φ’ when the wheelset is centred on the track differ substantially from the values found when a wheel has started to ride up the rail. To cover completely all values of ‘z’ and ‘ φ’ that can appear in a dynamic simulation , large data ranges should be used. In contrast, the method presented here establishes ranges of constant length, which are centred on the values obtained from the rigid-contact hypothesis. A significant saving is thus achieved in calculation time and the quantity of data involved.
4. Interpolation of the data The method presented here anticipates that, in cases of double contact points, the algorithms used to interpolate the normal forces, the indentations and the dimensions of the contact ellipse have to be different from those used to calculate the coordinates, slopes and curvatures at the contact points. Linear interpolation is used, except for normal forces and dimensions of the contact ellipse, where it has been found that a more accurate interpolation allows a great reduction in the quantity of data required. 4.1 Interpolation of the normal force There is a direct relationship between the position of the wheelset relative to the track and the indentations in the contact patches, which can be obtained using linear interpolation. The normal forces, however, are related to the indentations by the expression N = C · δ 3/2, so their relationships to the degrees of freedom of the wheelset are non-linear. One option, since the value of indentation is known, is to recalculate the corresponding normal force using the Hertz theory [5]. The other option is to interpolate the coefficients Ci = Ni / δi 3/2 instead of interpolating the normal forces. This coefficient and the interpolated indentation give the normal force using N = C · δ 3/2. It has been found that this method greatly improved the accuracy of the results. 4.2 Interpolation of the dimensions of the contact ellipse The semiaxes of the contact ellipse also depend non-linearly on the indentation value. The relationship in this case is: a = K · δ 1/2 b = K’ · δ 1/2 where a and b are the dimensions of the major and minor axes of the contact ellipse. The interpolation procedure is the same as that described for the normal forces, except that we now interpolate the K coefficients, obtained from Ki = ai / δi 1/2. 5. Results obtained for a single wheelset with simplified wheel and rail profiles In order to validate the proposed method for solving the elastic-contact problem in 3-D, it is first carried out the dynamic analysis of a simplified wheelset. A circular rail profile is used and the wheel profile has two straight sections, to simulate the tread and the flange (fig. 8, left). The reason for using these simplified profiles is that they allow the analysis of clear situations involving double contact points, as can be seen in figure 8.
α
Double contact point positions
y
Figure 8 (left). Simplified profiles of the wheel and the rail for the isolated-wheelset case. Figure 8 (right). Values of dof ‘y’ and ‘α’ for which double points of contact can occur.
The data table, in which the positions of the double contact points will be stored, is built first. Given the profiles used, it is clear that there must be ranges of lateral displacement and yaw angle for which two points of contact will exist simultaneously, one on the wheel tread and the other on the flange. In this case, the transition from the wheel tread to the flange occurs for lateral displacements of the order of 2 mm. Figure 8 (right), shows a two-dimensional map of the values of ‘y’ and ‘ α’ for which a double contact point situation can be produced. The darker colours inside the strip indicate a greater density of situations of double contact points. The results are based on the pre-calculated table obtained. It can be clearly seen that there is a range of lateral displacements for which such situations can occur, showing that the table is valid as regards the detection of the positions with double contact points. The lateral displacements at which the transition to the flange occurs are smaller as the yaw angle increases, as should be expected. The table shown by figure 8 right was calculated for a matrix of dof ‘y’, ‘ α’, ‘z’ and ‘ φ’ of 81 x 11 x 15 x 13, having a size of 10.4 Mb. The time required to calculate the table was 28 minutes using a Pentium IV with 1 Gb. of RAM. The table is loaded into the dynamic simulation program and the response of a single wheelset was calculated assuming a curve radius of 1000 m and a speed of 15 m/s. Figure 9 shows the results plotted against time for the lateral displacement and the yaw angle of the wheelset calculated using 2-D and 3-D contact models. The lateral displacement of the wheelset for the second case is smaller, due to the effective reduction of clearance caused by the yaw angle. 6
2 -D
5
2
4 α (o )
3
2
3 -D
4.7
4.4
4.2
3.9
3.6
3.3
3.1
2.8
2.5
2.2
1.9
1.7
1.4
1.1
0.8
0.0
4.7
4.2
3.9
3.6
3.3
3.1
2.8
2.5
2.2
1.9
1.7
1.4
1.1
0.8
0 0.6
0 0.3
1
0.6
2
1
0.0
2 -D and 3-D
3
0.3
1
4.4
y (m m )
3
t (s)
t (s)
Figure 9. Lateral displacement ‘y’ (left) and yaw angle ‘ α’ (right) of a single wheelset negotiating a curve with R=1000 m at a speed V=15 m/s Simplified wheel and rail profiles have been used. 60
70
50
50
60
40
40
50 Ν ( Κ Ν)
30
40 30
t (s )
t (s )
2 .9
2 .6
2 .3
2 .0
1 .7
1 .4
1 .1
0 .9
2 .9
2 .6
2 .3
2 .0
1 .7
1 .4
1 .2
0 .9
0 .6
0 .3
20
0 .0
2 .9
2 .6
2 .3
0
2 .0
0 1 .8
0 1 .5
10
1 .2
10
0 .9
10
0 .6
20
0 .3
20
0 .6
Ν ( ΚΝ ΚΝ))
30
0 .0
N (KN)
N2
N
0 .3
N1
0 .0
60
t (s )
Figure 10. Normal forces in the left wheel of the wheelset when negotiating a curve with R=1000 m. The first graph represents the normal force in the wheel tread, the second graph shows the normal force in the contact area of the flange, and the third graph shows the total normal force.
Similarly, figure 10 shows the normal forces in the outer wheel, indicating the force that corresponds to each of the contact points. It can clearly be seen that at first the only normal force appears in the first
contact point (the wheel tread). At a certain moment, a second contact point appears in the wheel flange, and the normal force starts to be transferred from the tread to the flange. In the final quasi-static equilibrium, part of the overall normal force acts in the wheel tread, and the rest (the greater part) is found in the flange. It can also be seen that the total normal force increases, which is normal in the wheel on the outside of the curve. Figure 11 compares the wear index and the the running safety coefficient calculated using 2-D and 3-D elastic-contact models.
20
2.7
2.5
2.4
2.2
2.0
1.8
t (s)
0.9
140
0.8
Total Wear Index
120
0.7
100
3-D
80 60
3-D
0.6 Y/Q
2-D
0.5 0.4 0.3 0.2
Nadal coefficient
0.1
t (s)
3.0
2.8
2.6
2.4
2.2
2.0
1.9
1.7
1.5
1.3
1.1
0.7
0.6
0.0 0.4
2.9
2.5
2.4
2.2
2.0
1.8
1.6
1.5
1.3
1.1
0.9
0.7
0.5
0.4
0.2
0.0
0
2.7
2-D
0.2
20
0.9
40
0.0
W (MN/m2)
1.6
1.5
0.0
t (s)
2.9
2-D
0
2.9
2.6
2.4
2.2
2.0
1.8
1.6
1.5
1.3
1.1
0.9
0.7
0.5
0.4
0.2
0
2.7
2-D
1.3
20
40
1.1
40
60
0.9
3-D
0.7
60
3-D
80
0.5
80
100
0.4
100
0.0
Wear Index on the flange contact
120 W (MN/m2)
120 W (MN/m2)
140
Wear Index on the thread contact
0.2
140
t (s)
Figure 11. The graphs show a comparison of the results obtained using 2-D and 3-D models for the single wheelset case with simplified profiles on a curve with R=1000 m. The following indices are shown for the outer wheel: the wear index for the contact on the wheel tread and the flange, the total wear index, and the Nadal coefficient.
The results show a large difference, since in this example, the yaw angle reaches very high values due to the use of a simplified model of wheelset. This example proofs that the method proposed provides good results when simulating in 3-D the multi-point contact. 6. Results obtained for a bogie using real profiles on a tight curve A contact table was calculated for the profiles represented in figure 12 (left): A UIC-54 rail and a DT-14 wheel on a metric-gauge wheelset and a bogie designed for urban traffic. The number of dof combinations was 121 x 9 x 25 x 21, having a size of 34 Mb. The time required for the calculation was 1h 28 m. Figure 12 (right) shows the positions of the double points of contact. It can be seen in this figure that there is a narrow range of values of ‘y’ for which the tr ansition of the contact region to the flange occurs. There is also a wider range of values for which two contact areas co-exist on the wheel tread.
Flange transition
α
y
Figure 12 (left). DT-14 wheel profile on UIC-54 rail. Figure 12 (right). Values of the dof ‘y’ and ‘ α’ for which a double contact point can occur for UIC-54 and DT-14 profiles.
The table described above was used to simulate the case of a bogie negotiating a curve with a radius of 60 m at a speed of 15 m/s. Figure 13 shows the results obtained for the lateral displacement and the angle of attack of the first wheelset, and the distribution of the normal force between the three regions of contact for the outer wheel. The 3-dimensional contact model was used. 5.0
40 .0 N (KN)
3.0
N1
30 .0 20 .0
8.9
8.4
8.0
7.5
7.0
6.6
6.1
5.6
5.1
4.7
4.2
3.7
3.3
2.8
2.3
1.9
0.0
1.4
1.0
0.9
Lateral displacement
0.5
10 .0
2.0
0.0
y (mm)
4.0
t (s )
8.8
8.3
7.9
7.4
6.9
6.5
6.0
5.5
5.1
4.6
4.2
3.7
3.2
2.8
2.3
1.8
1.4
0.9
0.5
0.0
0.0 40 Ν ( ΚΝ )
t (s )
30 20
N2
8.7
8.2
7.8
7.3
6.8
6.4
5.9
5.5
5.0
t (s )
0.8 0.6
40.0
Yaw angle
N (K N )
0.4 0.2
30.0
N3
20.0
t (s)
8.9
8.4
7.9
7.5
7.0
6.5
6.1
5.6
5.1
4.7
4.2
3.7
3.3
2.8
2.3
1.9
1.4
0.9
8.9
8.6
8.2
7.8
7.4
7.0
6.6
6.2
5.8
5.4
5.1
4.7
4.3
3.9
3.5
3.1
2.7
2.3
1.9
1.6
1.2
0.8
0.4
0.0
0.0
0.5
10.0
0.0
0.0
α (o)
4.6
4.1
3.6
3.2
2.7
2.3
1.8
1.4
0.9
1.0
0.5
0
0.0
10
t (s )
Figure 13. On the left, the lateral displacement in mm and the yaw angle in degrees for the first wheelset in the bogie when negotitating a curve with a radius of 60 m. On the right, distribution of the normal forces plotted against time for the three contact regions.
Figure 14 shows the differences obtained for the total wear index of the outer wheel when using the 2-D and the 3-D contact models. As can be seen, there is a very significant difference, and, obviously, the value is greater in the three-dimensional case, since the contact point on the flange is further forward, leading to a more unfavourable situation.
Wear index
35
3-D
30 25 20 15
2-D
10 5
8.6
8.1
7.6
7.1
6.6
6.1
5.6
5.1
4.6
4.1
3.6
3.1
2.5
2.0
1.5
1.0
0.5
0.0
0 t (s)
Figure 14. Global wear index for the outer wheel of the first wheelset calculated using 2-D and 3-D contact models, for an urban bogie on a curve with a radius of 60 m and UIC-54 and DT-14 profiles.
7. Conclusions The examples given above show that the method proposed is capable of solving in 3-D the wheel-rail elastic contact problem, including multi-point contact, with a view to performing a dynamic simulation of the vehicle. However, the crucial point is that, once the elastic contact table has been calculated, the dynamic analysis of a vehicle using a 3-D elastic contact model is almost as fast as when a 2-D analysis is carried out. Moreover, in either of these cases, the time required for the analysis is substantially lower than for an on-line solution of the contact problem in each integration step (fig. 15). t 165
13
1 Elastic 2-D contac table
1,05 Elastic 3-D contact table
Elastic 2-D contact on-line
Elastic 3-D contact on-line
Figure 15. Orientative calculation times for the different types of analysis used to solve the contact problem. These are all referenced to the rigid contact method, which has been given a value of one.
The differences in wear indices, running safety coefficient and forces in the contact areas can differ significantly, depending on whether a 2-D or 3-D contact analysis is used, as long as the yaw angle reaches significant values. These differences become insignificant on straight tracks or in large-radii curves. Therefore the method described here is specially suitable when analysing vehicles that will be used on lines with tight curves. References [1] Wickens, A.H., 2003, Fundamentals of Rail Vehicle Dynamics. Guidance and Stability (The Netherlands: Sweets & Zeitlinger) [2] Shabana, A.A., Zaazaa, K.E. and Escalona, J.L., Sany, J.R., 2004, Development of Elastic Force Model for Wheel/Rail Contact Problems. J. of Sound and Vibration 269, 295-325 [3] Pascal, J.P., 1993, About Multi-Hertzian Contact Hipothesis and Equivalent Coniciy in the case of S1002 and UIC60 Analytical Wheel/Rail Profiles. Vehicle System Dynamics 22, 263-275 [4] Vadillo, E.G., Giménez, J.G., 1985, Influence of the yaw rotation on the wheel – rail contact parameters. Procceedings of the 8th international wheelset congress 1 II.4 1-15 [5] Johnson, K.L., 1985, Contact Mechanics (Cambridge: Cambridge University Press)